Strategi Perdagangan Trend Adaptif dengan Integrasi Pelbagai Penunjuk

Gambaran Umum
Strategi ini adalah sistem perdagangan pengikut arah (trend following) adaptif yang menggabungkan beberapa penunjuk teknikal. Ia menggabungkan sistem purata bergerak (EMA), penunjuk momentum (RSI), penunjuk arah aliran (MACD) dan SuperTrend untuk pengesahan isyarat, serta dilengkapi dengan mekanisme pengurusan risiko yang lengkap, termasuk henti rugi, ambil untung dan henti rugi bergerak. Reka bentuk strategi mengambil kira turun naik pasaran, meningkatkan kestabilan dan kebolehpercayaan perdagangan melalui penapisan isyarat berbilang dan kawalan risiko.
Prinsip Strategi
Strategi menggunakan mekanisme pengesahan isyarat berbilang lapisan:
- Menentukan arah aliran awal melalui persilangan EMA 9 tempoh dan 21 tempoh
- Menggunakan RSI (14) untuk penapisan terlebih beli/terlebih jual, isyarat beli memerlukan RSI>40 dan <70, isyarat jual memerlukan RSI<60 dan >30
- Penunjuk MACD mengesahkan momentum arah aliran, memerlukan isyarat garisan selaras dengan arah garisan MACD
- Penunjuk SuperTrend memberikan pengesahan arah aliran tambahan
- Kawalan risiko menggunakan henti rugi 5%, ambil untung 10%, henti rugi menjejak 2% dan titik pulang modal 1%
Isyarat perdagangan hanya akan dicetuskan apabila semua syarat dipenuhi serentak, mengurangkan risiko penembusan palsu dengan berkesan.
Kelebihan Strategi
- Mekanisme pengesahan isyarat berbilang mengurangkan gangguan isyarat palsu dengan ketara
- Sistem kawalan risiko yang lengkap, termasuk henti rugi tetap, henti rugi bergerak dan henti rugi pulang modal
- Strategi mempunyai kebolehsuaian yang baik, boleh menyesuaikan diri dengan persekitaran pasaran yang berbeza
- Logik masuk dan keluar yang jelas, mudah difahami dan diselenggara
- Logik perdagangan mempunyai asas teori yang kukuh, setiap penunjuk mempunyai fungsi tertentu
Risiko Strategi
- Pengesahan isyarat berbilang mungkin menyebabkan terlepas beberapa peluang perdagangan penting
- Dalam pasaran yang bergelora secara mendadak, tahap henti rugi tetap mungkin tidak cukup fleksibel
- Pengoptimuman parameter boleh menyebabkan terlebih padanan (overfitting) dengan data sejarah
- Pelbagai penunjuk mungkin menghasilkan isyarat yang mengelirukan dalam pasaran mendatar
Penyelesaian termasuk: melaraskan parameter henti rugi secara dinamik, memperkenalkan penunjuk turun naik, mengoptimumkan semula parameter secara berkala, dsb.
Arah Pengoptimuman Strategi
- Memperkenalkan mekanisme parameter adaptif, melaraskan pelbagai parameter secara dinamik berdasarkan turun naik pasaran
- Menambah penunjuk volum sebagai alat pengesahan tambahan
- Mengoptimumkan mekanisme henti rugi, memperkenalkan henti rugi dinamik berdasarkan ATR
- Menambah modul pengenalpastian persekitaran pasaran, menggunakan kombinasi parameter yang berbeza dalam keadaan pasaran yang berbeza
- Membangunkan sistem pengoptimuman parameter berasaskan pembelajaran mesin
Kesimpulan
Strategi ini membina sistem perdagangan yang mantap melalui kerjasama penunjuk teknikal pelbagai dimensi. Mekanisme kawalan risiko yang lengkap dan logik perdagangan yang jelas menjadikannya praktikal. Walaupun terdapat ruang untuk pengoptimuman, rangka kerja asas strategi mempunyai asas teori yang kukuh. Melalui pengoptimuman dan penambahbaikan berterusan, ia dijangka dapat meningkatkan lagi prestasi perdagangannya.
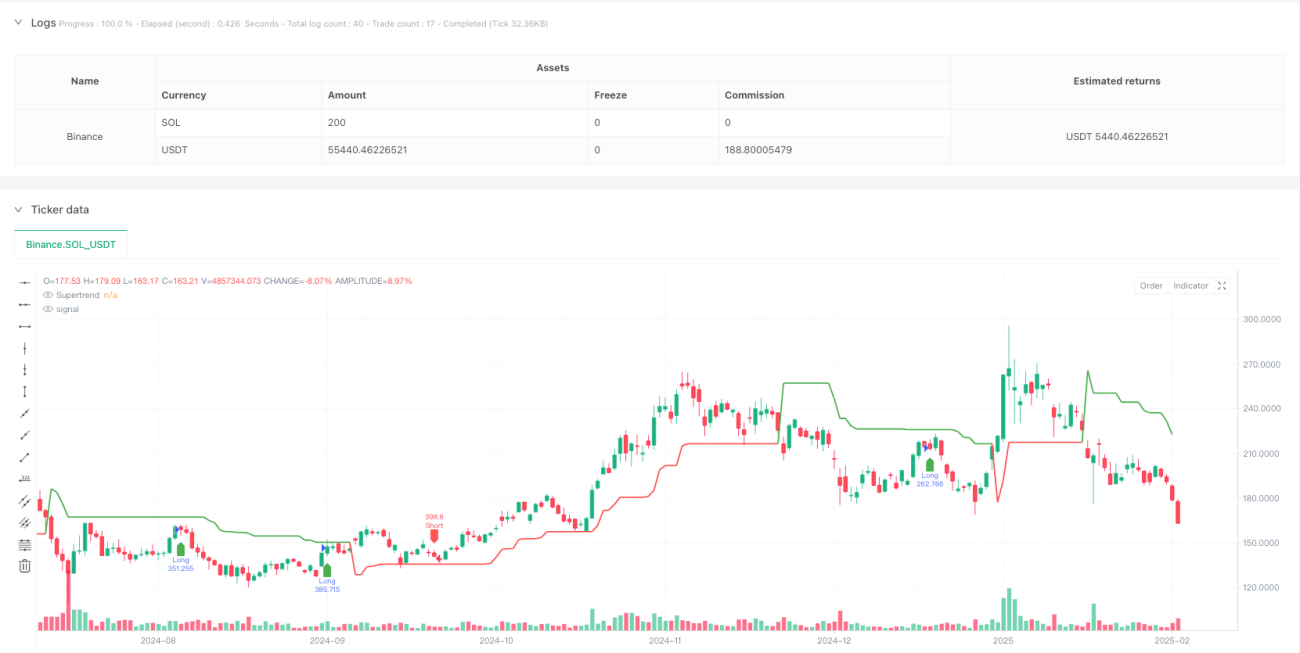
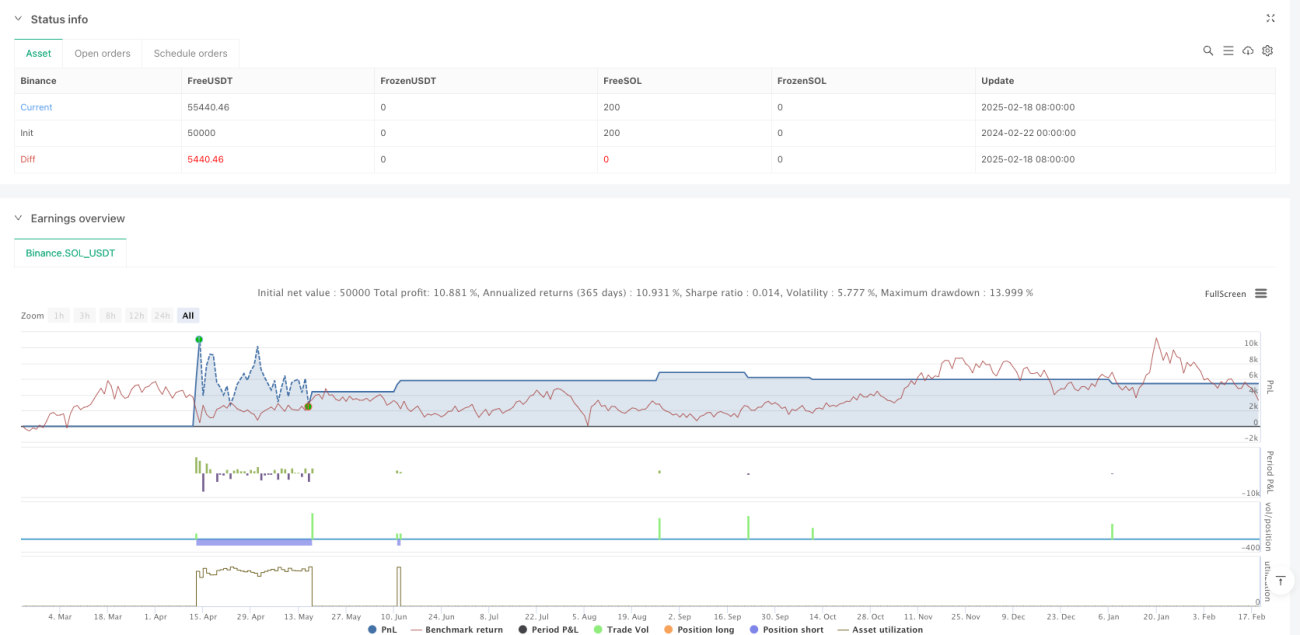
/*backtest
start: 2024-02-22 00:00:00
end: 2025-02-19 08:00:00
period: 1d
basePeriod: 1d
exchanges: [{"eid":"Binance","currency":"SOL_USDT"}]
*/

//@version=5
strategy("Optimized BTC Trading Strategy v2", overlay=true, default_qty_type=strategy.percent_of_equity, default_qty_value=100, commission_type=strategy.commission.percent, commission_value=0.1)

// Input parameters- 1