
Gambaran keseluruhan
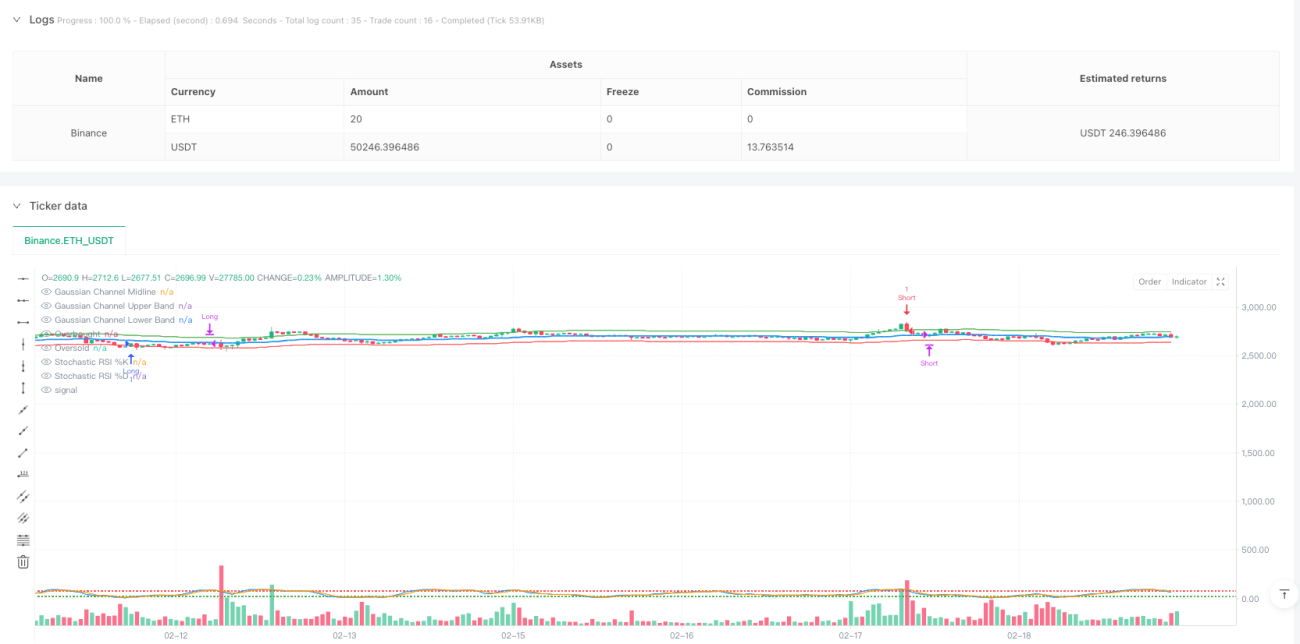
Strategi ini adalah sistem perdagangan yang mengesan trend yang menggabungkan Gaussian Channel dan indeks Stochastic RSI yang agak kuat secara rawak. Gaussian Channel digunakan untuk mengenal pasti trend harga dan julat turun naik, dan Stochastic RSI berfungsi sebagai penapis untuk mengesahkan keadaan overbought dan oversold, yang meningkatkan ketepatan isyarat perdagangan.
Prinsip Strategi
Logik teras strategi adalah berdasarkan komponen utama berikut:
- Pengiraan saluran Gaussian: Menggunakan penapis Gaussian untuk mengira garis tengah, dan menggunakan jalur saluran atas dan bawah berdasarkan tetapan kelipatan. Penapis Gaussian menggunakan kaedah penyelarasan indeks, yang dapat mengurangkan bunyi harga dengan berkesan.
- Stochastic RSI: menggabungkan kelebihan indikator rawak dan RSI untuk mengenal pasti keadaan overbought dan oversold melalui dua garis lurus %K dan %D.
- Syarat penyertaan:
- Bulu: Harga menembusi saluran Gauss dan Stochastic RSI berada di kawasan oversold
- Hulu kosong: Harga jatuh dari laluan Gaussian dan RSI Stochastic berada di kawasan overbought
- Syarat kejohanan:
- Apabila harga melintasi garis tengah saluran Gaussian
- Atau Stochastic RSI mencapai tahap overbought dan oversold yang bertentangan
Kelebihan Strategik
- Kebolehpercayaan isyarat yang tinggi: gabungan trend dan penunjuk momentum, dapat menyaring isyarat palsu dengan berkesan
- Pengendalian risiko yang sempurna: Menggunakan saluran Gauss sebagai tekanan sokongan dinamik, menyediakan kerangka pengurusan risiko yang baik
- Parameter yang boleh disesuaikan: lebar saluran dan parameter RSI boleh disesuaikan mengikut ciri-ciri pasaran yang berbeza
- Kecekapan pengiraan yang tinggi: Pengiraan Gaussian kecil, sesuai untuk perdagangan masa nyata
- Ketabahan: boleh digunakan dalam pelbagai kitaran masa dan keadaan pasaran
Risiko Strategik
- Risiko pasaran goyah: Isyarat pecah palsu yang kerap berlaku di pasaran setapak
- Risiko keterbelakangan: pengendalian penunjuk yang lancar akan menyebabkan kelewatan isyarat
- Sensitiviti parameter: kombinasi parameter yang berbeza boleh menyebabkan hasil dagangan yang berbeza secara ketara
- Kepercayaan kepada keadaan pasaran: lebih baik dalam pasaran yang sedang berkembang, tetapi mungkin akan mengalami penurunan yang lebih besar dalam pasaran yang berubah dengan cepat
Arah pengoptimuman strategi
- Pengoptimuman parameter dinamik:
- Mengubah lebar saluran mengikut turun naik pasaran
- Penyesuaian parameter RSI Stochastic berdasarkan ciri-ciri kitaran pasaran
- Mekanisme pengesahan isyarat:
- Tambahan penunjuk pengesahan jumlah transaksi
- Memperkenalkan penapis intensiti trend
- Pengurusan risiko dipertingkatkan:
- Mencapai stop loss dinamik
- Menyertai Modul Pengurusan Kedudukan
- Kenali keadaan pasaran:
- Membangunkan klasifikasi keadaan pasaran
- Menyesuaikan parameter strategi mengikut keadaan pasaran yang berbeza
ringkaskan
Strategi ini membina sistem perdagangan yang mempunyai ciri trend dan dinamik dengan menggabungkan Gaussian Channel dan Stochastic RSI. Strategi ini direka dengan munasabah, mempunyai skalabiliti dan daya serap yang baik. Dengan arah pengoptimuman yang disyorkan, anda dapat meningkatkan kestabilan dan keuntungan strategi. Dalam aplikasi sebenar, disarankan untuk menguji sepenuhnya kombinasi parameter yang berbeza dan melakukan pengoptimuman yang disasarkan berdasarkan ciri-ciri pasaran tertentu.
- 1