
Gambaran keseluruhan
Strategi ini adalah sistem perdagangan pengesanan trend berdasarkan penembusan Saluran Donchian, yang menggabungkan indikator SuperTrend dan penapis kuantiti transaksi untuk meningkatkan kebolehpercayaan isyarat perdagangan. Strategi ini mengidentifikasi peluang perdagangan berbilang arah yang berpotensi dengan menangkap harga yang melampaui ketinggian sejarah, sambil menggunakan pengesahan kuantiti transaksi dan indikator pengesanan trend untuk menyaring isyarat penembusan palsu.
Prinsip Strategi
Logik teras strategi adalah berdasarkan komponen utama berikut:
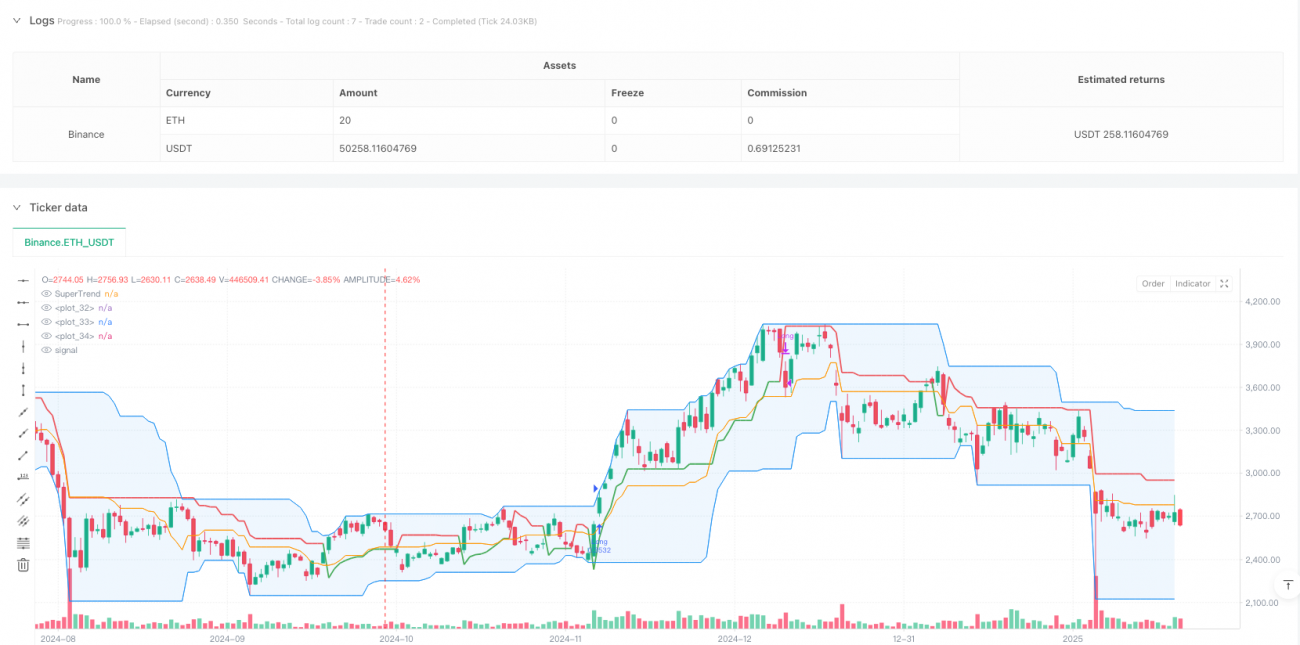
- Saluran Tongjian: Mengira harga tertinggi dan terendah dalam kitaran yang ditentukan oleh pengguna, membentuk lintasan atas, bawah dan tengah. Apabila harga menembusi lintasan atas, mencetuskan isyarat masuk berbilang arah.
- Penapis jumlah transaksi: meningkatkan kebolehpercayaan penembusan dengan membandingkan jumlah transaksi semasa dengan purata bergerak 20 kitaran, memastikan hanya memasuki permainan apabila jumlah transaksi meningkat.
- Indikator Super Trend: Sebagai alat pengesahan trend, menunjukkan warna hijau semasa trend multihead dan merah semasa trend kosong.
- Mekanisme Hentian Fleksibel: Terdapat empat pilihan Hentian yang berbeza, termasuk Hentian Bawah, Hentian Tengah, Hentian Super Trend dan Hentian Peratusan.
Kelebihan Strategik
- Pengesahan pelbagai isyarat: gabungan harga penembusan, pengesahan jumlah transaksi dan petunjuk trend, mengurangkan risiko penembusan palsu.
- Kebolehan beradaptasi: dapat menyesuaikan diri dengan keadaan pasaran dan kitaran perdagangan yang berbeza melalui penyesuaian parameter.
- Pengurusan risiko yang sempurna: menawarkan pelbagai pilihan untuk menghentikan kerugian, yang boleh dipilih dengan cara yang paling sesuai untuk menghentikan kerugian berdasarkan ciri-ciri pasaran.
- Kelihatan jelas: Antara muka strategi menunjukkan secara langsung pelbagai petunjuk untuk memudahkan peniaga memahami keadaan pasaran.
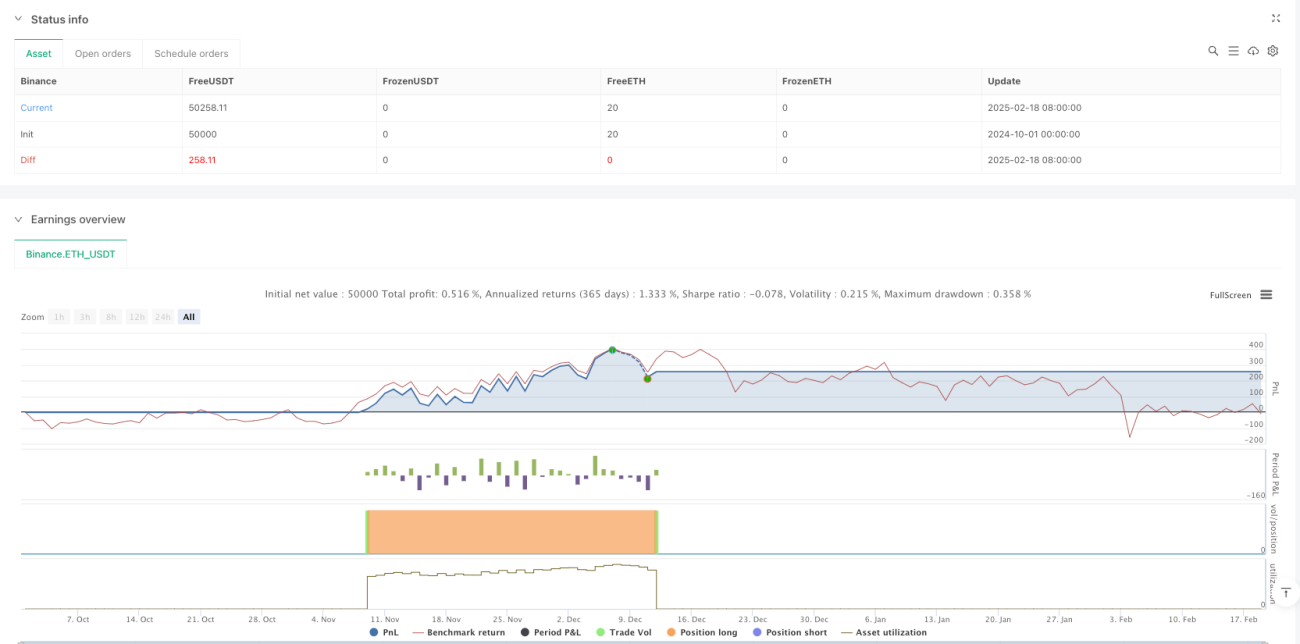
- Fleksibiliti pengembalian: membolehkan jangka masa pengembalian tersuai, memudahkan pengoptimuman strategi.
Risiko Strategik
- Risiko pasaran yang bergolak: Isyarat penembusan palsu yang kerap mungkin berlaku dalam keadaan golak.
- Risiko slippage: Dalam pasaran yang kurang cair, isyarat penembusan mungkin menyebabkan harga masuk menyimpang kerana slippage.
- Risiko penapisan yang berlebihan: Mengaktifkan penapisan jumlah transaksi mungkin menyebabkan anda terlepas peluang dagangan yang berkesan.
- Kepekaan parameter: Kesan strategi adalah sensitif kepada tetapan parameter dan memerlukan pengoptimuman yang teliti.
Arah pengoptimuman strategi
- Menambah penapis kekuatan trend: penunjuk kekuatan trend seperti ADX boleh ditambahkan, hanya masuk apabila trend kuat.
- Mengoptimumkan penunjuk lalu lintas: Anda boleh mempertimbangkan untuk menggunakan penunjuk lalu lintas relatif atau penunjuk lalu lintas terobosan sebagai pengganti purata bergerak sederhana.
- Tambah penapis masa: Tambah tetapan tetingkap masa perdagangan untuk mengelakkan pergerakan pasaran yang lebih besar.
- Pengoptimuman parameter dinamik: menyesuaikan secara automatik kitaran saluran dan parameter super trend mengikut turun naik pasaran.
- Memperkenalkan pembelajaran mesin: Mengoptimumkan pemilihan parameter dan penapisan isyarat menggunakan algoritma pembelajaran mesin.
ringkaskan
Strategi ini membina sistem perdagangan trend yang agak lengkap dengan menggunakan pelbagai petunjuk teknikal secara komposit. Kelebihan strategi ini adalah kebolehpercayaan isyarat yang tinggi, fleksibiliti pengurusan risiko, tetapi masih memerlukan pedagang untuk mengoptimumkan parameter mengikut ciri-ciri pasaran tertentu. Dengan penambahbaikan dan pengoptimuman berterusan, strategi ini dijangka mendapat kesan perdagangan yang stabil di pasaran trend.
- 1