Strategi pembalikan lanjutan berdasarkan RSI dan volum dalam perdagangan kuantitatif

Gambaran keseluruhan
Ini adalah strategi perdagangan terbalik berdasarkan RSI dan jumlah transaksi. Strategi ini mengidentifikasi keadaan overbought dan oversold di pasaran, menggabungkan pengesahan transaksi, dan mengambil perdagangan terbalik ketika harga berada dalam keadaan yang melampau. Gagasan utama strategi ini adalah untuk melakukan perdagangan apabila RSI menunjukkan isyarat overbought atau oversold, dan jumlah transaksi lebih tinggi daripada rata-rata, melalui garis tengah RSI ((50) sebagai isyarat keluar.
Prinsip Strategi
Strategi ini berdasarkan kepada komponen teras berikut:
- Pengiraan RSI: Menggunakan RSI 14 kitaran untuk memantau pergerakan harga
- Pengesahan jumlah transaksi: Menggunakan purata bergerak jumlah transaksi dalam 20 kitaran ((SMA)
- Logik input:
- Multilevel entry: apabila RSI di bawah 30 (atau oversold) dan volume transaksi lebih besar daripada purata bergerak
- Kemasukan kosong: apabila RSI lebih tinggi daripada 70 (atau overbought) dan jumlah transaksi lebih besar daripada purata bergerak
- Logik keluar:
- Perlawanan beramai-ramai: RSI memakai 50
- Bermula dengan kepala kosong: RSI di bawah 50
Kelebihan Strategik
- Keputusan dagangan yang sistematik: membina sistem dagangan yang objektif melalui gabungan penunjuk teknikal yang jelas
- Mekanisme pengesahan berbilang: menggabungkan dua dimensi RSI dan jumlah transaksi untuk meningkatkan kebolehpercayaan isyarat
- Pengendalian risiko yang sempurna: Peratusan pengurusan dana dan larangan untuk membina semula simpanan
- Sokongan visual: merangkumi fungsi paparan carta lengkap untuk analisis dan pemantauan mudah
- Kebolehsuaian: parameter utama boleh disesuaikan untuk menyesuaikan diri dengan keadaan pasaran yang berbeza
Risiko Strategik
- Risiko berterusan trend: Strategi pembalikan mungkin sering rugi dalam pasaran yang sedang trend kuat
- Risiko Terobosan Palsu: Jumlah Dagangan Tinggi Tidak Perlu Bermakna Pertukaran Pasaran
- Sensitiviti parameter: RSI kitaran dan pilihan untuk overbought dan oversold had kesan yang ketara terhadap prestasi strategi
- Kesan Sliding Point: Dalam tempoh turun naik yang teruk, harga dagangan mungkin jauh daripada jangkaan
- Risiko pengurusan wang: kedudukan kadar tetap mungkin terlalu radikal dalam keadaan pasaran tertentu
Arah pengoptimuman strategi
- Penapisan Trend: memperkenalkan indikator penilaian trend untuk mengelakkan perdagangan terbalik semasa trend yang kuat
- Parameter dinamik: RSI yang disesuaikan secara dinamik berdasarkan turun naik pasaran
- Pengoptimuman keluar: meningkatkan mekanisme henti rugi dan pengesanan henti rugi, meningkatkan keupayaan kawalan risiko
- Peningkatan analisis kuantiti transaksi: penambahan analisis bentuk kuantiti transaksi untuk meningkatkan kualiti isyarat
- Penapisan masa: Tambahkan tetingkap masa perdagangan untuk mengelakkan masa perdagangan yang tidak cekap
ringkaskan
Strategi ini membina sistem perdagangan terbalik yang lengkap dengan menggabungkan indikator RSI dan analisis kuantiti transaksi. Strategi direka dengan munasabah, mempunyai kebolehgunaan dan fleksibiliti yang baik. Dengan arah pengoptimuman yang dicadangkan, strategi ini masih mempunyai ruang untuk peningkatan lebih lanjut. Apabila digunakan secara langsung, disarankan untuk menguji parameter dengan baik dan mengoptimumkan sasaran dengan ciri-ciri pasaran.
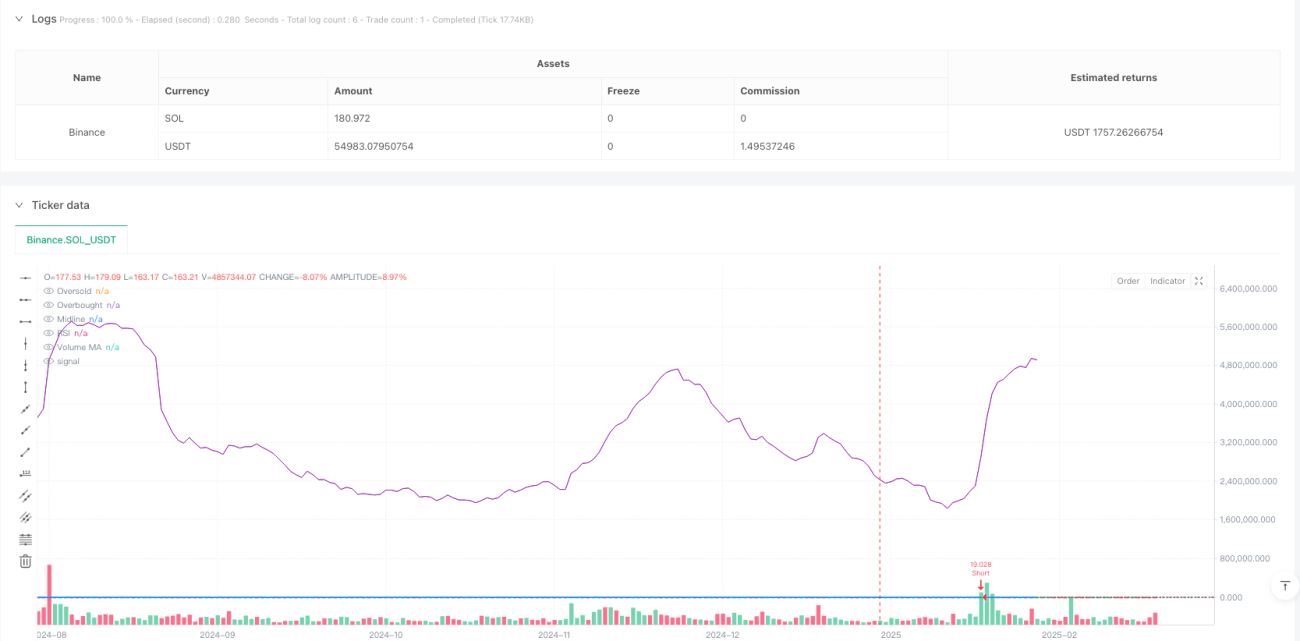
/*backtest
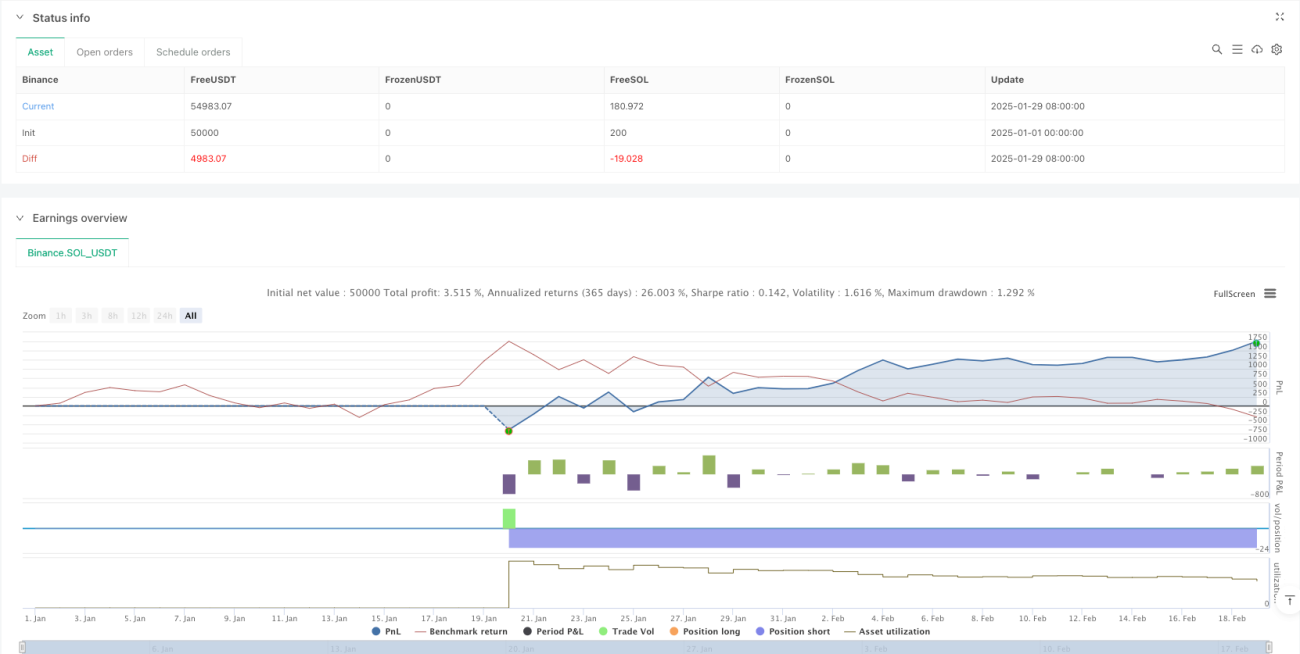
start: 2025-01-01 00:00:00
end: 2025-02-19 08:00:00
period: 1d
basePeriod: 1d
exchanges: [{"eid":"Binance","currency":"SOL_USDT"}]
*/
//@version=5
strategy("RSI & Volume Contrarian Strategy", overlay=true, initial_capital=100000, default_qty_type=strategy.percent_of_equity, default_qty_value=10, pyramiding=0)
//---------------------------- 1