Gambaran keseluruhan
Strategi ini adalah sistem perdagangan trend-tracking yang menggabungkan purata bergerak indeks (EMA) dan purata bergerak sederhana (SMA). Strategi ini menggunakan EMA50 dan EMA150 untuk menghasilkan isyarat perdagangan, menggunakan SMA150 sebagai garis hentian dan menyertakan mekanisme kemasukan semula selepas hentian. Reka bentuk ini dapat menangkap trend jangka panjang dan jangka panjang dan dapat mengawal risiko dengan berkesan.
Prinsip Strategi
Logik teras strategi merangkumi elemen utama berikut:
- Isyarat masuk: apabila EMA50 ke atas melintasi EMA150, menghasilkan isyarat berbilang; apabila EMA50 ke bawah melintasi EMA150, menghasilkan isyarat kosong.
- Mekanisme Hentikan Kerosakan: Apabila harga jatuh di bawah SMA 150, ia akan mencetuskan kedudukan Hentikan Kerosakan.
- Mekanisme kemasukan semula: Setelah mencetuskan stop loss, masuk semula jika harga menembusi EMA150 lagi; masuk kosong jika EMA50 lagi menembusi EMA150 lagi.
- Pelaksanaan perdagangan: Strategi menjalankan perdagangan dalam jangka masa yang ditetapkan dan mengambil kira komisen 0.1% dan titik slippage 3 mata.
Kelebihan Strategik
- Keupayaan untuk menjejaki trend yang kuat: Dengan menggunakan kombinasi garis rata-rata dari pelbagai kitaran, ia dapat menangkap trend pasaran dengan berkesan.
- Kawalan risiko yang baik: menetapkan syarat-syarat yang jelas untuk menghentikan kerugian dan mengelakkan kerugian yang berlebihan.
- Fleksibiliti mekanisme kemasukan semula: membenarkan kemasukan semula apabila keadaan pasaran bertambah baik, meningkatkan peluang keuntungan.
- Tetapan parameter adalah munasabah: Pilihan kitaran EMA50 dan EMA150 menyeimbangkan sensitiviti dan kestabilan.
- Pertimbangkan kos urus niaga sebenar: termasuk komisen dan faktor slip, lebih dekat dengan persekitaran urus niaga sebenar
Risiko Strategik
- Risiko pasaran goyah: Dalam pasaran goyah yang berpanjangan, isyarat penembusan palsu mungkin sering berlaku.
- Risiko ketinggalan: Indeks purata bergerak itu sendiri mempunyai ketinggalan dan mungkin terlepas masa kemasukan terbaik.
- Risiko kemasukan semula: Dalam pasaran yang bergolak, mekanisme kemasukan semula boleh menyebabkan kerugian berturut-turut.
- Risiko pengurusan wang: Strategi tidak merangkumi program pengurusan kedudukan khusus.
- Ketergantungan kepada keadaan pasaran: Strategi mungkin mempunyai perbezaan yang besar dalam prestasi dalam kitaran pasaran yang berbeza.
Arah pengoptimuman strategi
- Pengenalan penunjuk kadar turun naik: ATR atau Bollinger Bands boleh ditambah untuk menyesuaikan kedudukan hentian, menjadikan hentian lebih fleksibel.
- Pengurusan kedudukan yang lebih baik: disyorkan untuk memasukkan sistem pengurusan kedudukan dinamik berdasarkan kadar turun naik.
- Optimumkan keadaan kemasukan semula: boleh digabungkan dengan RSI dan lain-lain untuk meningkatkan ketepatan isyarat kemasukan semula
- Menambah penapisan keadaan pasaran: Tambah indikator kekuatan trend, mengurangkan frekuensi dagangan di pasaran yang kurang trend.
- Membangunkan parameter penyesuaian diri: boleh menyesuaikan kitaran garis purata secara dinamik mengikut turun naik pasaran.
ringkaskan
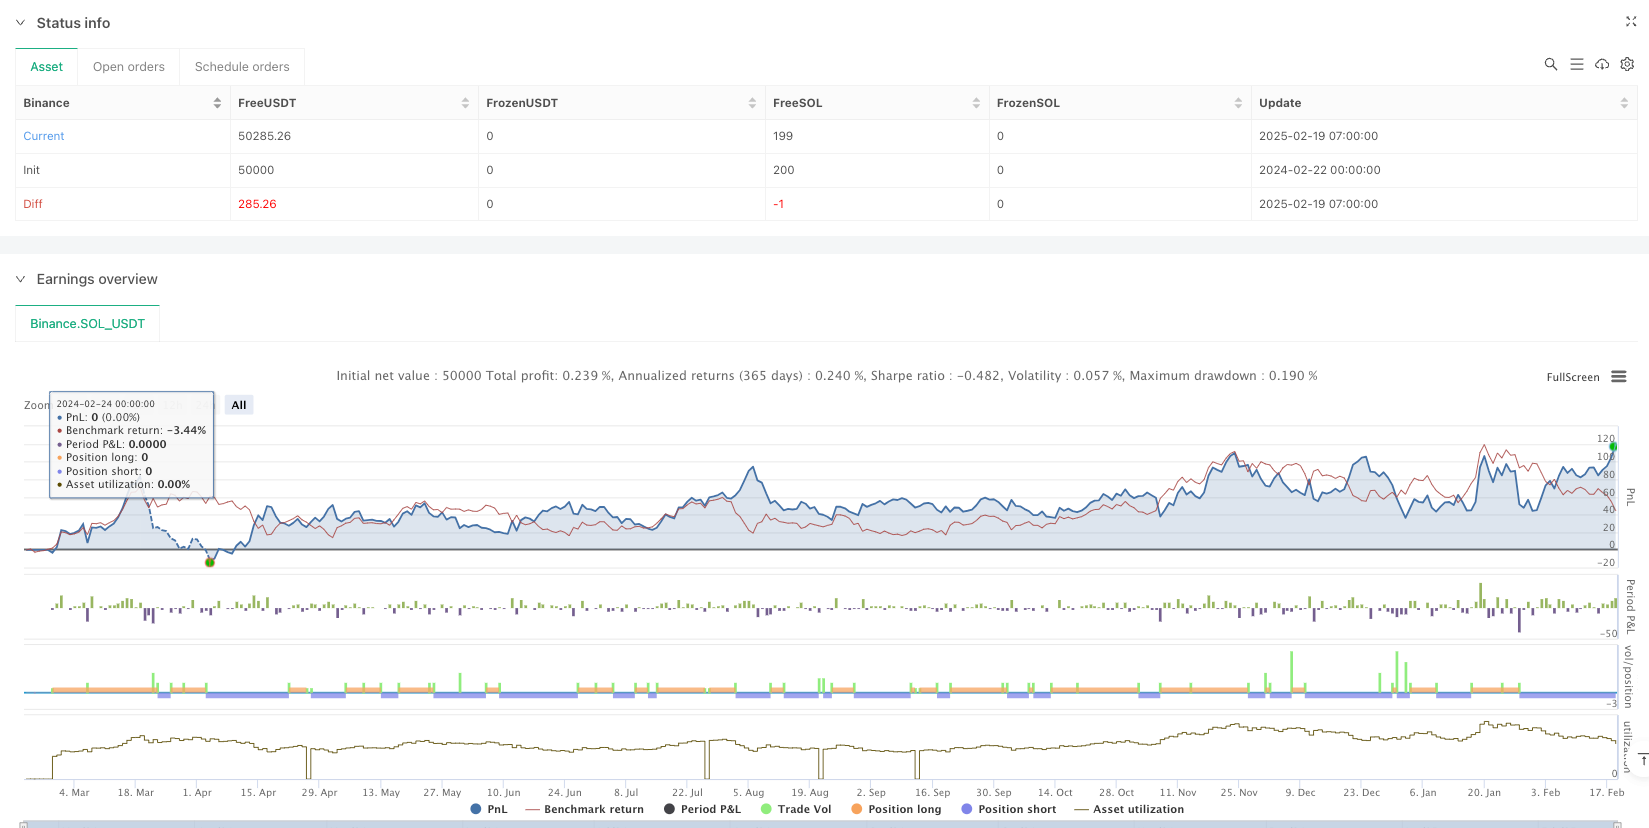
Ini adalah strategi pengesanan trend yang direka dengan munasabah, menangkap trend melalui penyeberangan linear, dan dilengkapi dengan mekanisme kawalan risiko yang sempurna. Kelebihan utama strategi adalah keupayaan sistem untuk mengesan trend dan reka bentuk pengurusan risiko, tetapi dalam aplikasi praktikal, perlu memperhatikan kesan persekitaran pasaran terhadap prestasi strategi. Dengan arah pengoptimuman yang disyorkan, strategi masih mempunyai ruang untuk meningkatkan lagi.
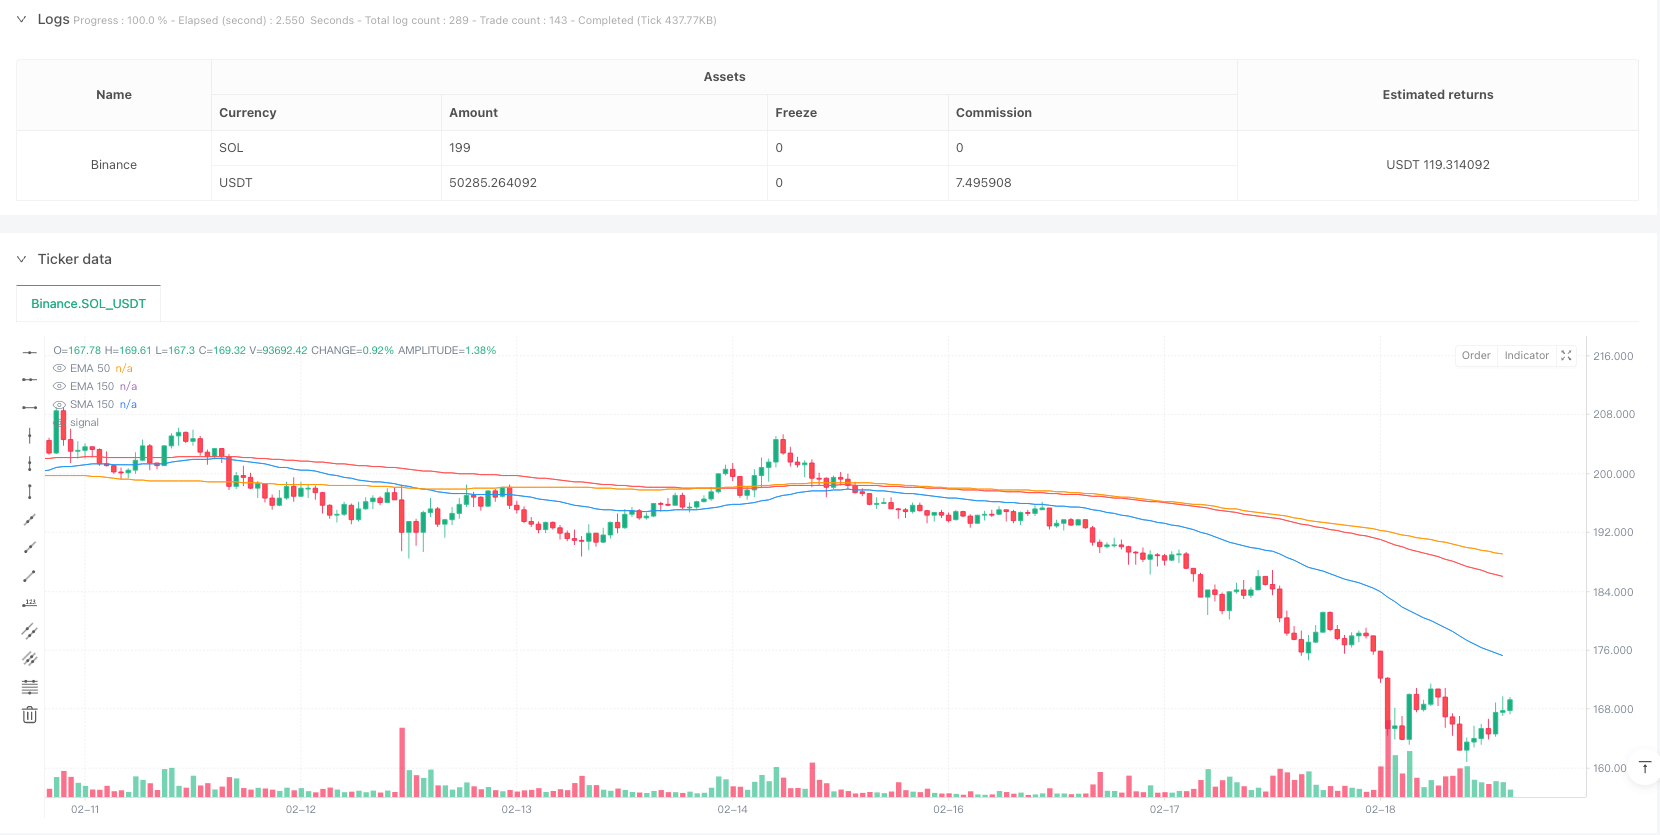
/*backtest
start: 2024-02-22 00:00:00
end: 2025-02-19 08:00:00
period: 1h
basePeriod: 1h
exchanges: [{"eid":"Binance","currency":"SOL_USDT"}]
*/

//@version=6
strategy("EMA 50 and EMA 150 with SMA150 Stop-loss and Re-Entry #ganges", overlay=true, commission_type=strategy.commission.percent, commission_value=0.1, slippage=3)


// EMA and SMA Calculations
ema50 = ta.ema(close, 50)
ema150 = ta.ema(close, 150)
sma150 = ta.sma(close, 150)

// Conditions for Buy, Sell, and Stop-Loss
ema50CrossAboveEMA150 = ta.crossover(ema50, ema150)  // Buy signal
ema50CrossBelowEMA150 = ta.crossunder(ema50, ema150) // Sell signal
priceCrossAboveEMA150 = ta.crossover(close, ema150) // Price crosses EMA 150 from below
priceCloseBelowSMA150 = close < sma150              // Stop-loss for long positions


// Track stop-loss hit state
var bool stopLossHit = false

// Strategy Logic
// Buy Logic: EMA 50 crosses EMA 150 from below
if ema50CrossAboveEMA150
    strategy.entry("Buy Signal", strategy.long, qty=1)
    stopLossHit := false // Reset stop-loss state when a new buy position is opened

// Sell Logic: EMA 50 crosses EMA 150 from above
if ema50CrossBelowEMA150
    strategy.entry("Sell Signal", strategy.short, qty=1)
    stopLossHit := false // Reset stop-loss state when a new sell position is opened

// Stop-Loss for Long Positions: Close if price falls below SMA 150
if strategy.position_size > 0 and priceCloseBelowSMA150
    strategy.close("Buy Signal")
    stopLossHit := true // Mark stop-loss hit

// Re-Entry Logic After Stop-Loss
if stopLossHit
    if priceCrossAboveEMA150 // Re-buy logic: PRICE crosses EMA 150 from below
        strategy.entry("Re-Buy Signal", strategy.long, qty=1)
        stopLossHit := false // Reset stop-loss state after re-entry
    if ema50CrossBelowEMA150 // Re-sell logic: EMA 50 crosses EMA 150 from above
        strategy.entry("Re-Sell Signal", strategy.short, qty=1)
        stopLossHit := false // Reset stop-loss state after re-entry

// Plot EMA and SMA Lines
plot(ema50, color=color.blue, title="EMA 50")
plot(ema150, color=color.red, title="EMA 150")
plot(sma150, color=color.orange, title="SMA 150")


// // Calculate Recent All-Time High
// highestHigh = ta.highest(high, 500) // Lookback period of 500 bars
// percentageFall = ((highestHigh - close) / highestHigh) * 100

// // Display Percentage Fall on the Most Recent Candle Only
// isLastBar = bar_index == ta.max(bar_index)
// if isLastBar
//     labelText = str.tostring(percentageFall, "#.##") + "% Fall from ATH"
//     labelPosition = high + ta.atr(14) * 2 // Positioning label above the candle
//     label.new(bar_index, labelPosition, labelText, color=color.red, textcolor=color.white, size=size.small, style=label.style_label_down)