
2
Follow
478
Followers
Gambaran keseluruhan
Strategi ini adalah sistem perdagangan penapis ganda yang menggabungkan RSI (indikator yang agak kuat) dan garis rata-rata trend. Strategi ini berdagang di peringkat garis matahari dengan menggabungkan isyarat RSI yang terlalu banyak dan terlalu banyak dengan garis rata-rata trend jangka panjang.
Prinsip Strategi
Strategi ini berdasarkan kepada komponen teras berikut:
- RSI digunakan untuk mengenal pasti kawasan overbought dan oversold, dengan parameter lalai 14 kitaran
- Tahap overbuy ditetapkan pada 70, dan tahap oversell ditetapkan pada 30.
- Purata bergerak sederhana 200 kitaran sebagai penapis trend
- Syarat pembelian: RSI melangkau dari kawasan oversold dan harga berada di atas garis purata
- Syarat jual: RSI melangkaui ke bawah dari kawasan overbought dan harga berada di bawah garis purata
Strategi melakukan perdagangan secara automatik pada setiap isyarat yang muncul, dan fungsi peringatan boleh dikonfigurasi.
Kelebihan Strategik
- Mekanisme pengesahan dua kali meningkatkan kebolehpercayaan transaksi dengan ketara
- Mengurangkan risiko isyarat palsu dengan menggabungkan trend dan momentum
- Sistem pelaksanaan transaksi automatik sepenuhnya
- Tetapan parameter yang fleksibel membolehkan pengoptimuman dasar
- Fungsi peringatan masa nyata yang bersepadu untuk memudahkan operasi
- Antara muka visual untuk memaparkan isyarat perdagangan dengan jelas
- Menyokong fungsi pengesanan semula untuk pengesahan strategi
Risiko Strategik
- Pasaran yang bergolak mungkin menghasilkan isyarat dagangan yang kerap
- Kemungkinan titik balik trend terlewat
- Tetapan parameter yang tidak betul boleh menjejaskan prestasi strategi
- Kemunculan pasaran yang melampau boleh menyebabkan penarikan balik yang lebih besar
Ia disyorkan untuk menguruskan risiko dengan:
- Tetapkan kedudukan henti rugi yang munasabah
- Menyesuaikan saiz kedudukan dengan betul
- Sentiasa mengoptimumkan parameter strategi
- Kaedah penilaian tambahan dalam kombinasi dengan penunjuk teknikal lain
Arah pengoptimuman strategi
- Menambah penapis turun naik untuk menyesuaikan piawaian dagangan semasa turun naik yang tinggi
- Memperkenalkan mekanisme parameter penyesuaian diri, menyesuaikan parameter secara dinamik mengikut keadaan pasaran
- Tambah mekanisme pengesahan volum untuk meningkatkan kebolehpercayaan isyarat
- Membangunkan mekanisme keluar yang lebih kompleks, mengoptimumkan masa tamat keuntungan
- Mengintegrasikan analisis kitaran masa berbilang untuk memberikan pandangan pasaran yang lebih menyeluruh
ringkaskan
Strategi ini membina sistem perdagangan yang stabil dengan menggabungkan RSI dan trend line. Strategi ini direka dengan munasabah, peraturan operasi yang jelas, dan kepraktisan yang baik. Dengan pengurusan risiko yang munasabah dan pengoptimuman berterusan, strategi ini dijangka memperoleh keuntungan yang stabil dalam perdagangan sebenar.
Source
Pine
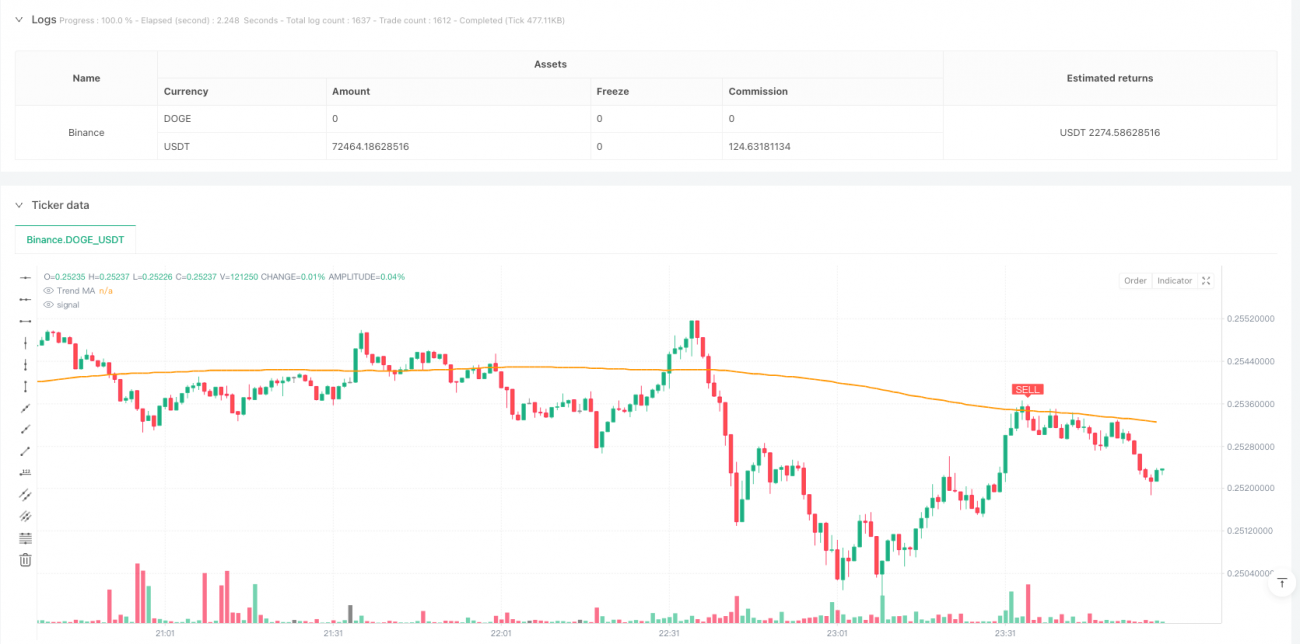
/*backtest
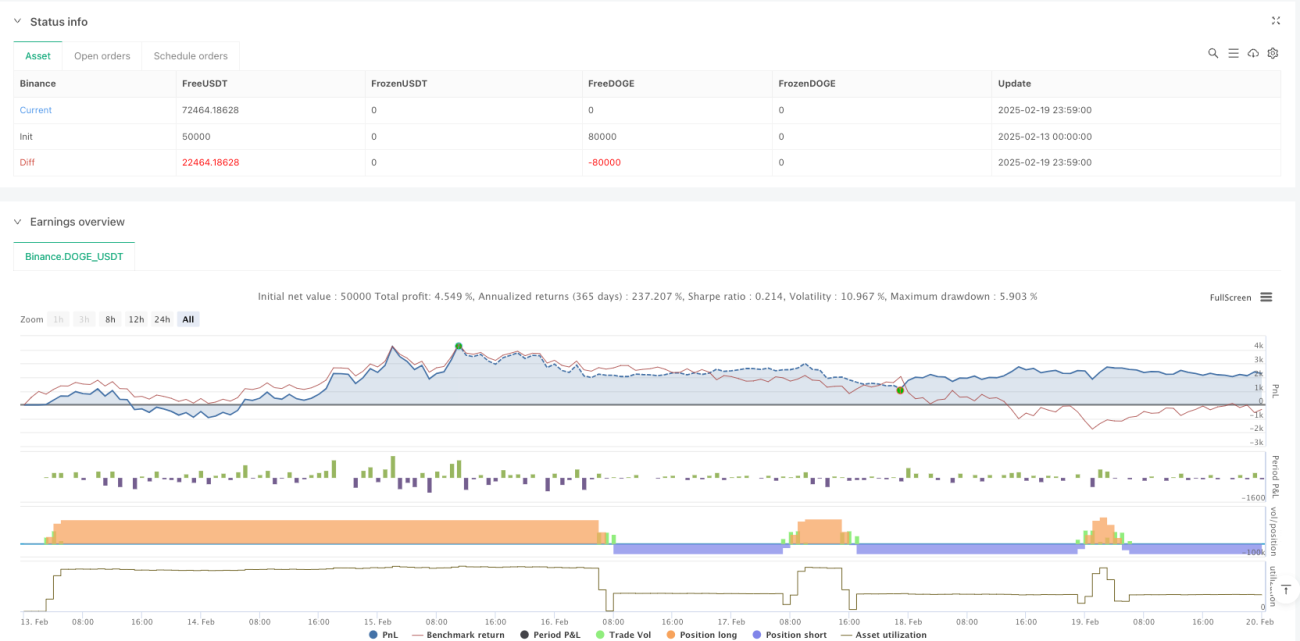
start: 2025-02-13 00:00:00
end: 2025-02-20 00:00:00
period: 1m
basePeriod: 1m
exchanges: [{"eid":"Binance","currency":"DOGE_USDT"}]
*/
//@version=5
strategy("Leading Indicator Strategy – Daily Signals", overlay=true,
pyramiding=1, initial_capital=100000,
default_qty_type=strategy.percent_of_equity, default_qty_value=100)Strategy parameters
Related strategies
Comment
All comments (0)
No data
- 1