Strategi Persilangan Momentum Trend Dinamik - Sistem Perdagangan Kuantitatif Berdasarkan Penunjuk Dwi EMA dan MACD

Gambaran keseluruhan
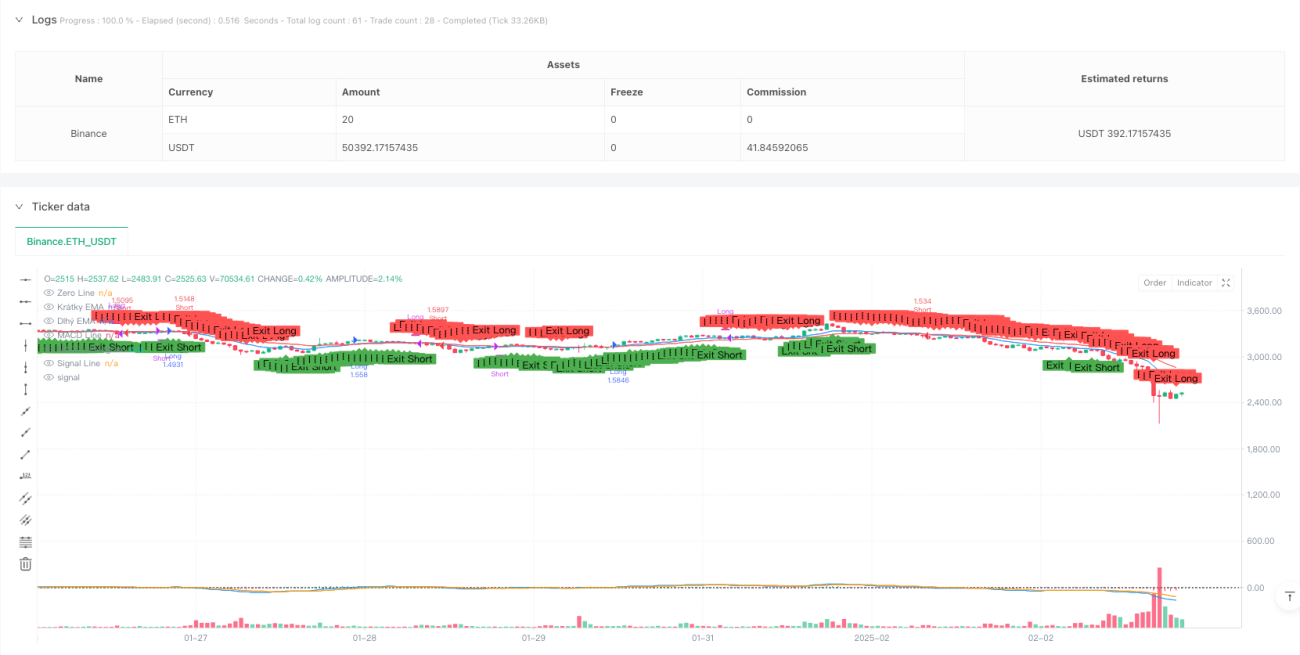
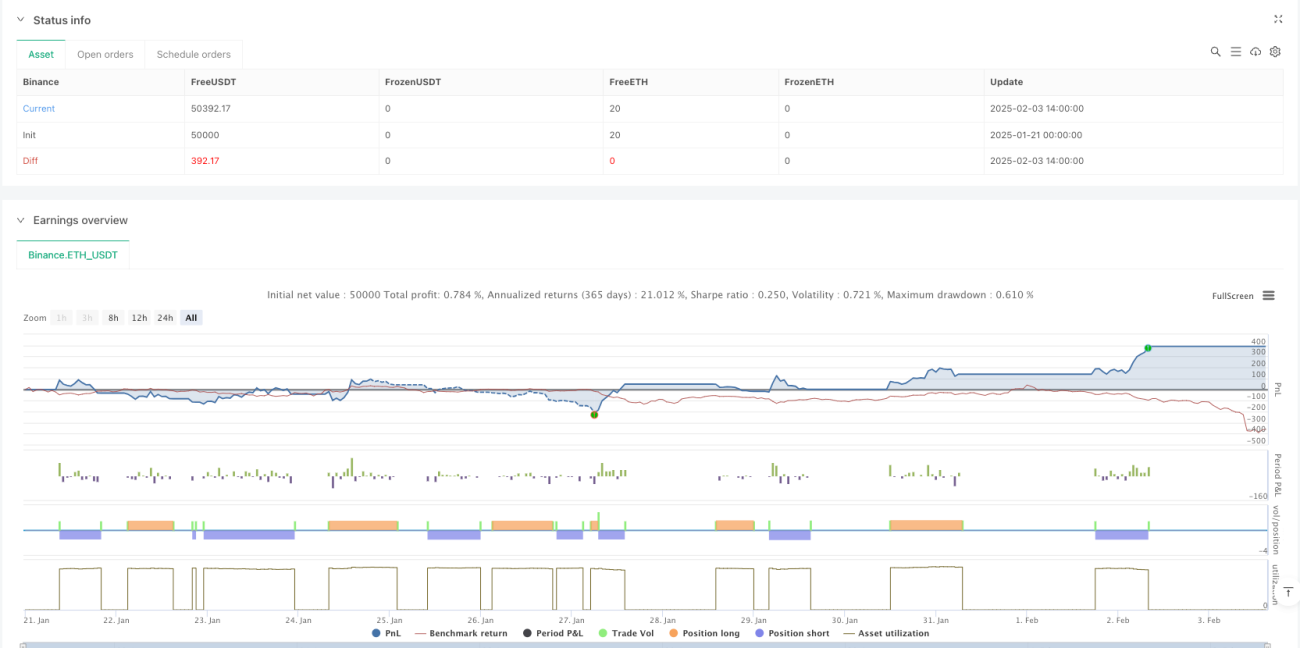
Strategi ini adalah sistem perdagangan kuantitatif yang menggabungkan indeks moving averages (EMA) dan trend moving averages (MACD). Dengan menggabungkan isyarat silang EMA jangka pendek dan jangka panjang, serta pengesahan pergerakan MACD, ia menyediakan pedagang dengan penyelesaian pemantauan trend yang komprehensif. Strategi ini juga merangkumi mekanisme berhenti dan berhenti yang dinamik untuk mengawal risiko dengan berkesan sambil memaksimumkan keuntungan.
Prinsip Strategi
Logik teras strategi ini adalah berdasarkan pada sinergi antara dua petunjuk teknikal. Pertama, menggunakan EMA 12 dan 26 kitaran untuk mengenal pasti trend pasaran, menghasilkan isyarat melakukan banyak apabila EMA jangka panjang melintasi EMA jangka pendek, dan menghasilkan isyarat menutup apabila ia melintasi. Kedua, menggunakan isyarat MACD (tetapan 12, 26, 9) untuk mengesahkan momentum trend, yang memerlukan hubungan kedudukan garis MACD dengan isyarat untuk menyokong isyarat perdagangan yang dihasilkan oleh EMA.
Kelebihan Strategik
- Mekanisme pengesahan isyarat yang sempurna: pengesahan dua kali melalui EMA silang dan MACD, mengurangkan risiko penembusan palsu
- Fleksibiliti dalam pengurusan risiko: menggunakan peratusan stop loss untuk menyesuaikan diri dengan keadaan pasaran dan jenis perdagangan yang berbeza
- Kesan visual yang hebat: Garis EMA, penunjuk MACD dan tanda isyarat perdagangan ditunjukkan dengan jelas pada carta
- Kebolehsuaian parameter: membolehkan penyesuaian kitaran EMA, parameter MACD dan nisbah kawalan risiko untuk strategi perdagangan yang berbeza
Risiko Strategik
- Risiko trend reversal: kemungkinan terdapat crossover yang kerap berlaku dalam pasaran yang bergolak, menyebabkan isyarat palsu
- Masalah ketinggalan: EMA dan MACD adalah penunjuk ketinggalan, yang mungkin terlepas titik masuk terbaik dalam perjalanan pantas
- Risiko pengurusan wang: Stop loss peratusan tetap mungkin tidak fleksibel dalam persekitaran turun naik yang tinggi
- Risiko pengoptimuman parameter: pengoptimuman berlebihan boleh menyebabkan strategi tidak dapat mencapai hasil pengembalian dalam talian
Arah pengoptimuman strategi
- Pengenalan penunjuk kadar turun naik: penambahan penunjuk ATR disyorkan untuk menyesuaikan tahap hentian dan hentian secara dinamik
- Menambah penapis keadaan pasaran: anda boleh menilai kekuatan trend melalui indikator seperti ADX, dan mengelakkan perdagangan di pasaran yang bergolak
- Mekanisme pengesahan isyarat yang dioptimumkan: pertimbangkan untuk menambah pengesahan jumlah pesanan atau penunjuk momentum lain sebagai bantuan
- Pengurusan wang yang lebih baik: mewujudkan sistem pengurusan kedudukan dinamik berdasarkan hak dan kepentingan akaun
ringkaskan
Ini adalah strategi untuk mengesan trend yang dirancang dengan logik dan logik yang jelas. Dengan menggabungkan kelebihan EMA dan MACD, menghasilkan isyarat perdagangan yang lebih dipercayai sambil mengekalkan strategi yang mudah difahami.
- 1