Strategi Pembalikan Arah Aliran Dwi Momentum Berdasarkan RSI dan RSI Stochastic

Gambaran keseluruhan
Ini adalah strategi perdagangan berbalik arah yang menggabungkan indikator RSI yang agak kuat (RSI) dan indikator RSI yang agak kuat (RSI Stochastic). Strategi ini menangkap potensi berbalik arah dengan mengenal pasti keadaan pasaran yang lebih baik dan lebih baik dan perubahan momentum.
Prinsip Strategi
Logik utama strategi ini merangkumi langkah-langkah penting berikut:
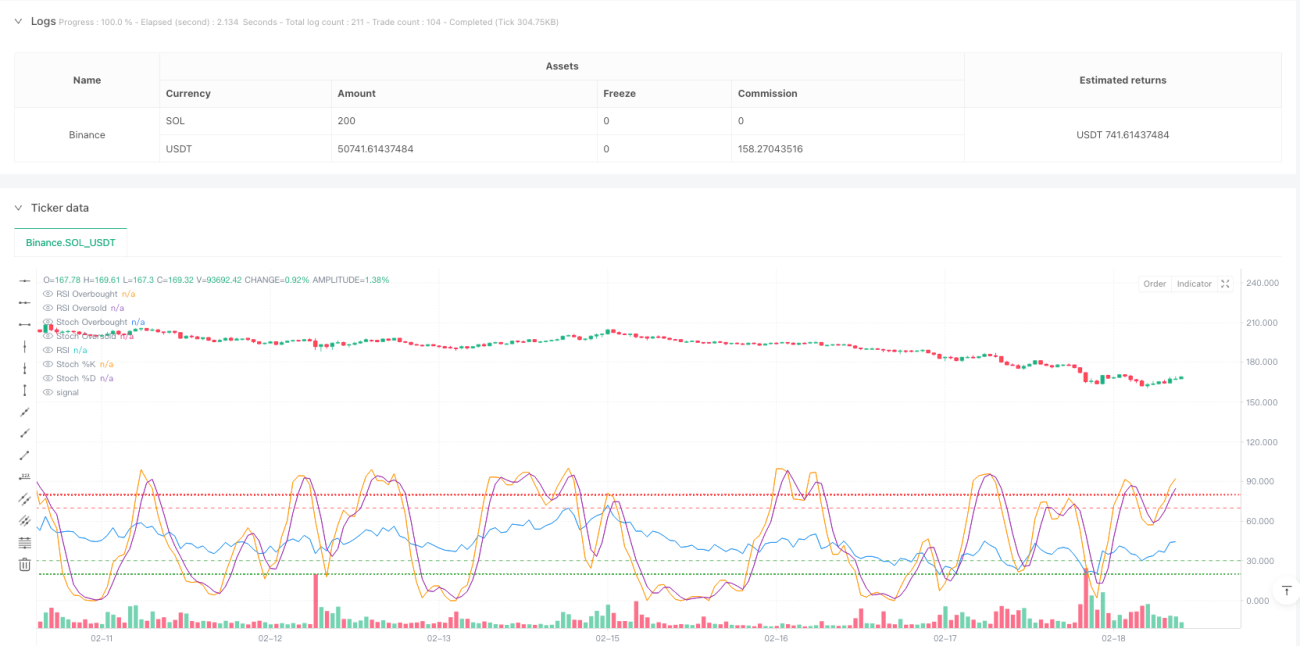
- Bermula dengan mengira nilai RSI pada harga penutupan untuk menilai keadaan overbought dan oversold secara keseluruhan
- Perhitungan berdasarkan nilai RSI % K dan % D garis Stochastic RSI
- Apabila RSI berada di kawasan oversold (< 30 secara default) dan garis %K Stochastic RSI melintasi garis %D dari bawah ke atas, ia akan mencetuskan isyarat lebih
- Sinyal shorting dicetuskan apabila RSI berada di kawasan overbought (default lebih tinggi daripada 70) dan %K garis Stochastic RSI melintasi %D dari atas ke bawah
- Apabila terdapat keadaan RSI yang berlawanan atau apabila RSI Stokastik bertukar ke arah yang berlawanan, kedudukan rata dikeluarkan.
Kelebihan Strategik
- Mekanisme pengesahan dua kali ganda - Mengurangkan risiko penembusan palsu dengan berkesan dengan menggunakan RSI dan RSI Stochastic
- Parameter yang boleh disesuaikan - parameter utama strategi seperti kitaran RSI, overbought dan oversold, dan sebagainya boleh disesuaikan dengan keadaan pasaran yang berbeza
- Visualisasi dinamik - Strategi menyediakan paparan carta RSI dan Stochastic RSI dalam masa nyata untuk memudahkan pedagang untuk memantau
- Pengurusan risiko bersepadu - mengandungi mekanisme berhenti kerugian dan menutup keuntungan yang lengkap
- Adaptif - boleh digunakan dalam tempoh masa yang berbeza dan keadaan pasaran
Risiko Strategik
- Risiko pasaran yang bergolak - kemungkinan munculnya isyarat palsu yang kerap dalam pasaran yang bergolak
- Risiko keterlambatan - isyarat mungkin mengalami keterlambatan tertentu kerana penggunaan multigaris rata-rata
- Sensitiviti parameter - tetapan parameter yang berbeza boleh menyebabkan hasil transaksi yang berbeza secara ketara
- Kepercayaan kepada keadaan pasaran - mungkin terlepas sebahagian daripada pasaran yang sedang tren
- Pengurusan risiko wang - perlu menetapkan nisbah pegangan yang munasabah untuk mengawal risiko
Arah pengoptimuman strategi
- Tambah penapis trend - purata bergerak jangka panjang boleh ditambah sebagai penapis trend, hanya mengambil kedudukan di arah trend
- Mekanisme hentian yang dioptimumkan - boleh memperkenalkan hentian dinamik, seperti hentian tracking atau hentian ATR
- Pengenalan penunjuk lalu lintas - Analisis lalu lintas gabungan dapat meningkatkan kebolehpercayaan isyarat
- Menambah penapis masa - mengelakkan siaran berita penting atau pergerakan rendah
- Membangunkan parameter penyesuaian - menyesuaikan parameter strategi secara automatik mengikut turun naik pasaran
ringkaskan
Ini adalah strategi komprehensif yang menggabungkan momentum dan trend reversal untuk mengenal pasti peluang perdagangan yang berpotensi melalui sinergi RSI dan Stochastic RSI. Strategi ini direka dengan munasabah, mempunyai kebolehpasaran dan penyesuaian yang lebih baik. Tetapi dalam aplikasi praktikal, perlu berhati-hati dengan pilihan dan kawalan risiko persekitaran pasaran, disarankan untuk melakukan pengembalian dan pengoptimuman parameter yang mencukupi sebelum berdagang secara langsung.
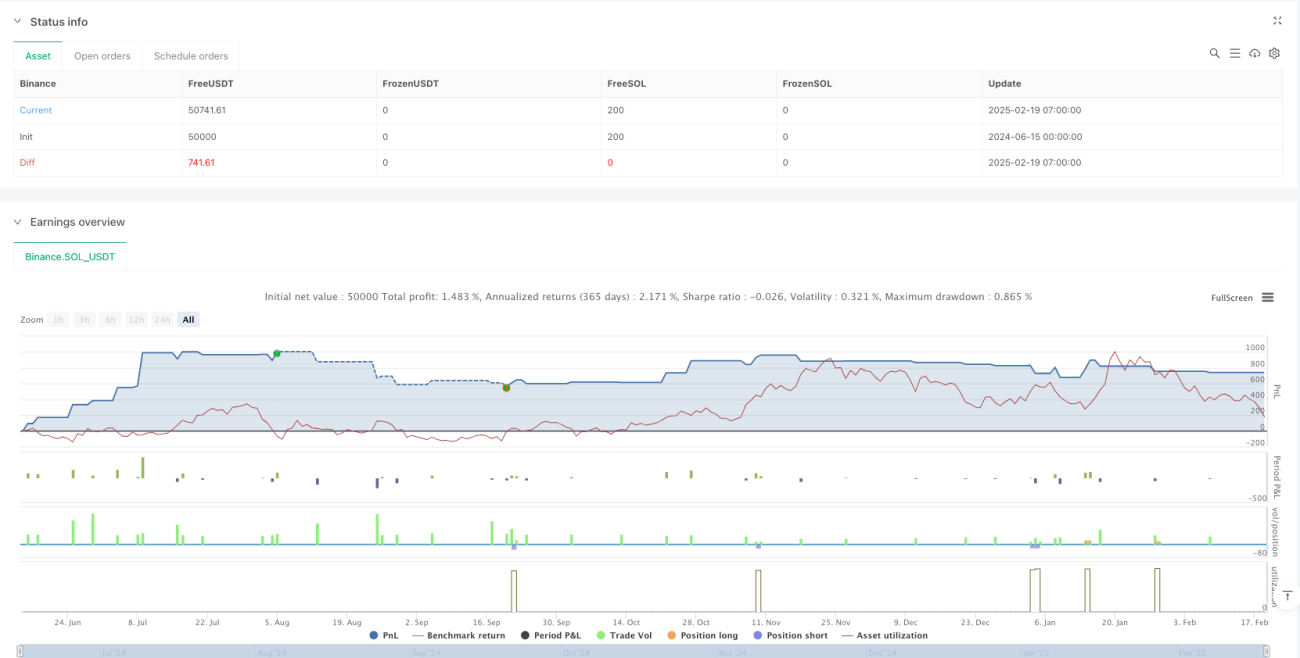
/*backtest
start: 2024-06-15 00:00:00
end: 2025-02-19 08:00:00
period: 1h
basePeriod: 1h
exchanges: [{"eid":"Binance","currency":"SOL_USDT"}]
*/

//@version=5
strategy("RSI + Stochastic RSI Strategy", overlay=true, initial_capital=100000, default_qty_type=strategy.percent_of_equity, default_qty_value=10)

// INPUTS- 1