
Gambaran keseluruhan
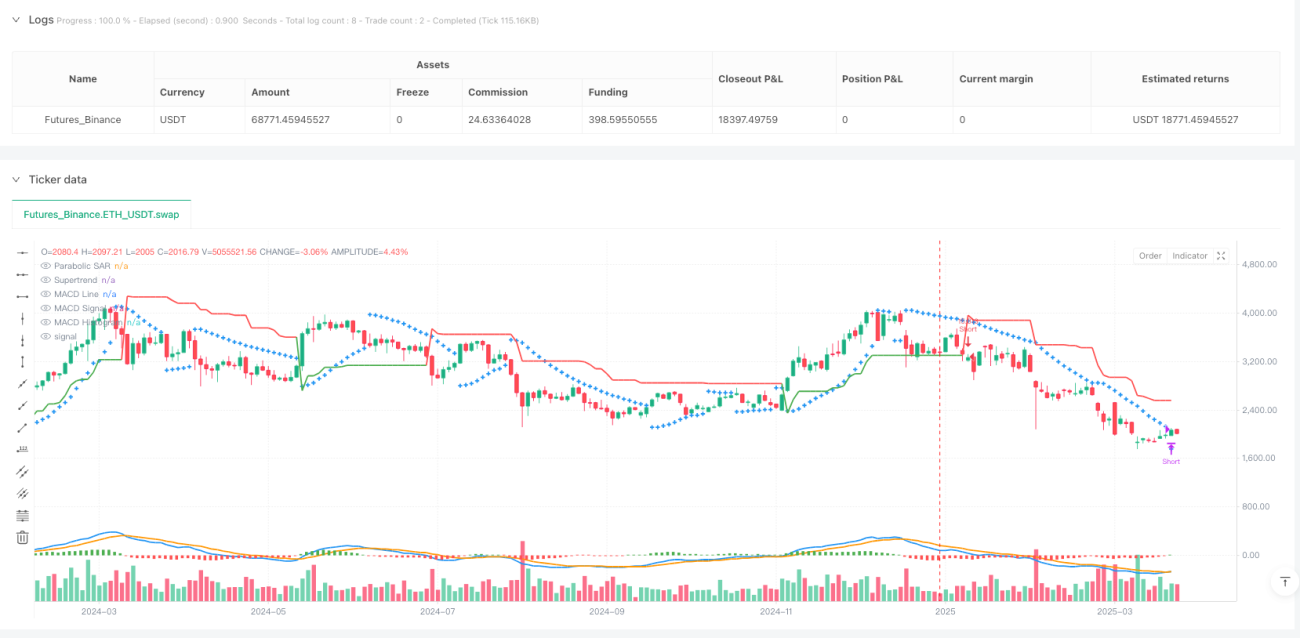
Strategi ini adalah kaedah perdagangan kuantitatif yang komprehensif untuk mengenal pasti trend pasaran dan isyarat perdagangan dengan mengintegrasikan beberapa petunjuk teknikal (MACD, Supertrend dan Parabolic SAR). Strategi ini bertujuan untuk menyediakan kerangka keputusan perdagangan yang fleksibel dan ketat yang dapat disesuaikan dengan keadaan pasaran yang berbeza.
Prinsip Strategi
Prinsip strategi ini berdasarkan kepada gabungan dinamik tiga petunjuk teknikal utama:
- Indeks MACD: menilai pergerakan harga dan arah trend
- Penunjuk Supertrend: menilai trend dominan pasaran (berbentuk lebih banyak atau lebih kosong)
- Parabolic SAR: memberi isyarat masuk dan keluar yang tepat
Strategi membuat keputusan perdagangan dengan logik berikut:
- Syarat kemasukan untuk pelaburan lama:
- Garis MACD lebih tinggi daripada garis isyarat
- Supertrend berwarna hijau (berbentuk pelbagai)
- Harga penutupan melebihi Parabolic SAR
- Syarat kemasukan:
- Garis MACD lebih rendah daripada garis isyarat
- Supertrend berwarna merah (tanpa tajuk)
- Harga penutupan lebih rendah daripada Parabolic SAR
Kelebihan Strategik
- Pengesahan komprehensif pelbagai indikator: mengurangkan risiko isyarat palsu
- Trigger isyarat yang fleksibel: tidak memerlukan urutan isyarat yang ketat
- Strategi perdagangan penuh: memaksimumkan potensi keuntungan setiap dagangan
- Logik dagangan simetri: berprestasi sama dalam pasaran berbilang dan kosong
- Mekanisme keluar yang dinamik: mengelakkan keluar awal dengan mengesahkan dua garis K berturut-turut
Risiko Strategik
- Risiko ketinggalan indikator: Indeks teknikal berdasarkan data sejarah, mungkin terdapat kelewatan
- Risiko perdagangan penuh: Stop loss yang tidak ditetapkan boleh menyebabkan turun naik dana yang lebih besar
- Risiko turun naik pasaran: keadaan pasaran yang rumit mungkin mempengaruhi prestasi strategi
- Sensitiviti parameter: Pilihan parameter penunjuk mempengaruhi kesan strategi secara langsung
Arah pengoptimuman strategi
- Memperkenalkan pengurusan kedudukan dinamik: menyesuaikan saiz kedudukan mengikut turun naik pasaran
- Peningkatan kawalan kerugian: mengurangkan kerugian maksimum dalam satu transaksi
- Optimumkan parameter penunjuk: cari kombinasi parameter terbaik melalui pengukuran semula
- Memperkenalkan syarat penapisan tambahan: seperti jumlah dagangan, indikator kadar turun naik
- Menambah pengesahan pelbagai kerangka masa: meningkatkan kebolehpercayaan isyarat
ringkaskan
Vishal Adaptive Multi Indicator Trading Strategy adalah kaedah perdagangan kuantitatif yang inovatif yang menyediakan kerangka keputusan perdagangan yang komprehensif dan fleksibel melalui sinergi MACD, Supertrend, dan Parabolic SAR. Walaupun terdapat risiko tertentu, verifikasi dan logik perdagangan simetri multiindicator memberikan model perdagangan yang layak untuk dipelajari oleh pelabur.
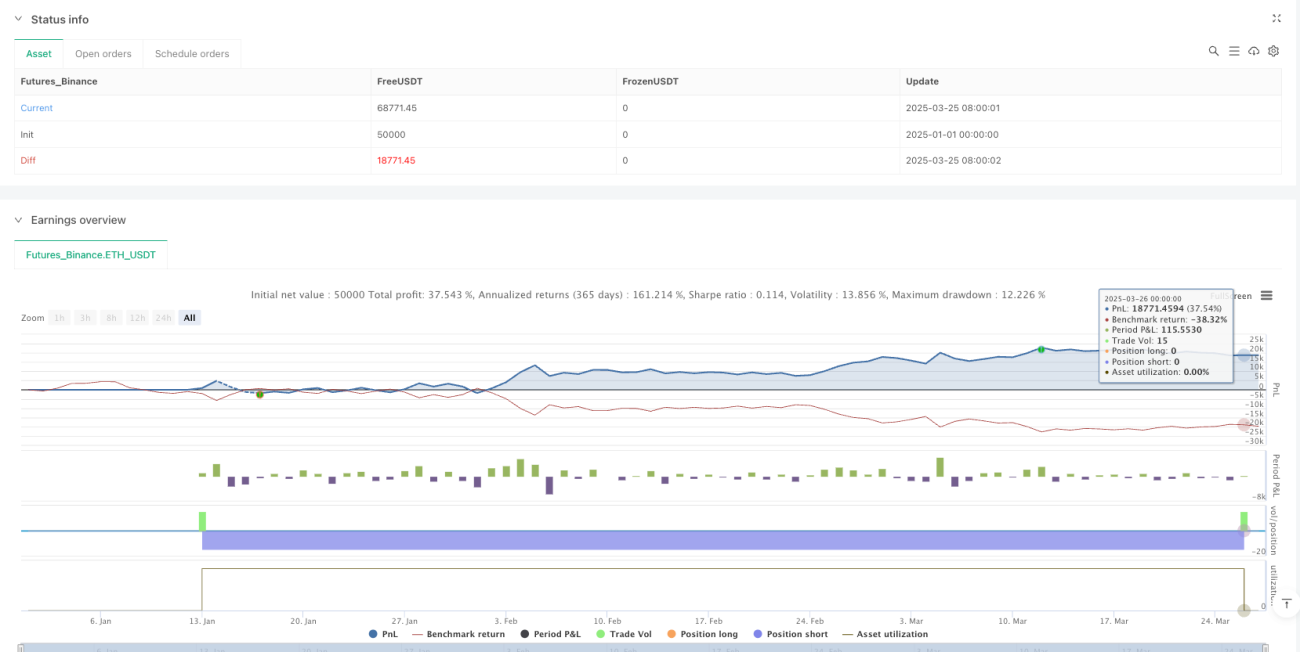
/*backtest
start: 2025-01-01 00:00:00
end: 2025-03-27 00:00:00
period: 2d
basePeriod: 2d
exchanges: [{"eid":"Futures_Binance","currency":"ETH_USDT"}]
*/

//@version=6
strategy("Vishal Strategy", overlay=true, margin_long=100, margin_short=100, initial_capital=100000, default_qty_type=strategy.percent_of_equity, default_qty_value=100)

// **MACD Inputs & Calculation**- 1