
Gambaran Keseluruhan
Strategi Momentum Suai Trend Teori Dow ialah pendekatan dagangan lanjutan berdasarkan prinsip Teori Dow klasik, yang membimbing keputusan dagangan dengan mengenal pasti titik perubahan utama dalam arah aliran pasaran. Strategi ini memberi tumpuan kepada mengesan dan mengesahkan dinamik asas arah aliran harga, menggunakan Puncak Lebih Tinggi (Higher Highs) dan Lantai Lebih Tinggi (Higher Lows) untuk mentakrifkan arah aliran menaik, serta Puncak Lebih Rendah (Lower Highs) dan Lantai Lebih Rendah (Lower Lows) untuk mentakrifkan arah aliran menurun. Kaedah ini bertujuan untuk menyediakan pendekatan sistematik untuk menangkap arah aliran pasaran dan bertindak balas dengan segera apabila arah aliran berubah.
Prinsip Strategi
Prinsip teras strategi ini adalah berdasarkan kaedah pengenalpastian arah aliran Teori Dow klasik. Strategi ini mengesan titik perubahan utama menggunakan fungsi ta.pivothigh() dan ta.pivotlow(). Pelaksanaan khusus merangkumi langkah-langkah utama berikut:
- Pengesanan Titik Perubahan: Gunakan parameter
pivotLookbackuntuk menentukan bilangan palang di kedua-dua belah bagi mengenal pasti puncak dan lantai. - Pengesahan Arah Aliran: Arah aliran menaik hanya disahkan apabila kedua-dua syarat Puncak Lebih Tinggi dan Lantai Lebih Tinggi dipenuhi; begitu juga, arah aliran menurun hanya disahkan apabila kedua-dua syarat Puncak Lebih Rendah dan Lantai Lebih Rendah dipenuhi.
- Kesinambungan Arah Aliran: Jika syarat perubahan arah aliran tidak dipenuhi, strategi akan mengekalkan status arah aliran sebelumnya, membolehkan penjejakan arah aliran yang lebih lancar.
Kelebihan Strategi
- Pengenalpastian Arah Aliran Dinamik: Dengan menganalisis titik perubahan utama secara berterusan, strategi ini dapat menangkap perubahan arah aliran pasaran secara dinamik.
- Mod Dagangan Fleksibel: Menyediakan tiga mod dagangan - automatik, panjang sahaja (long-only), dan pendek sahaja (short-only) - untuk memenuhi keperluan pedagang yang berbeza.
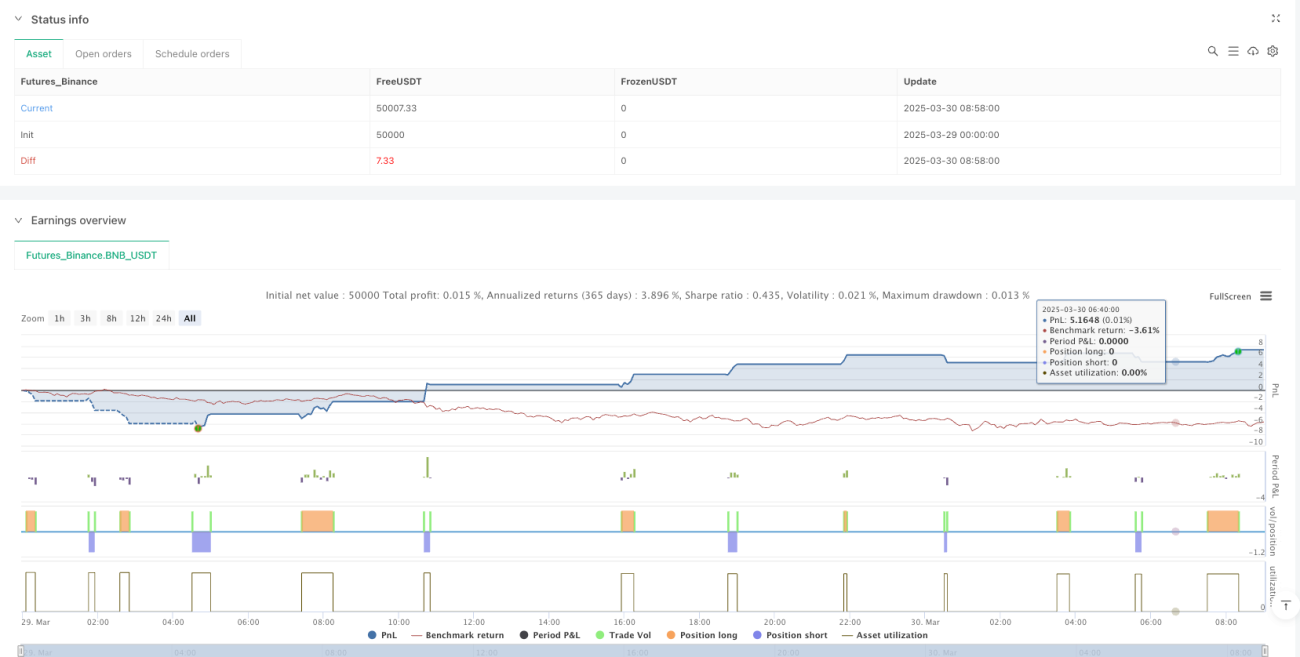
- Pengurusan Risiko: Mekanisme henti rugi (stop-loss) dan ambil untung (take-profit) terbina dalam dapat mengawal risiko setiap dagangan dengan berkesan.
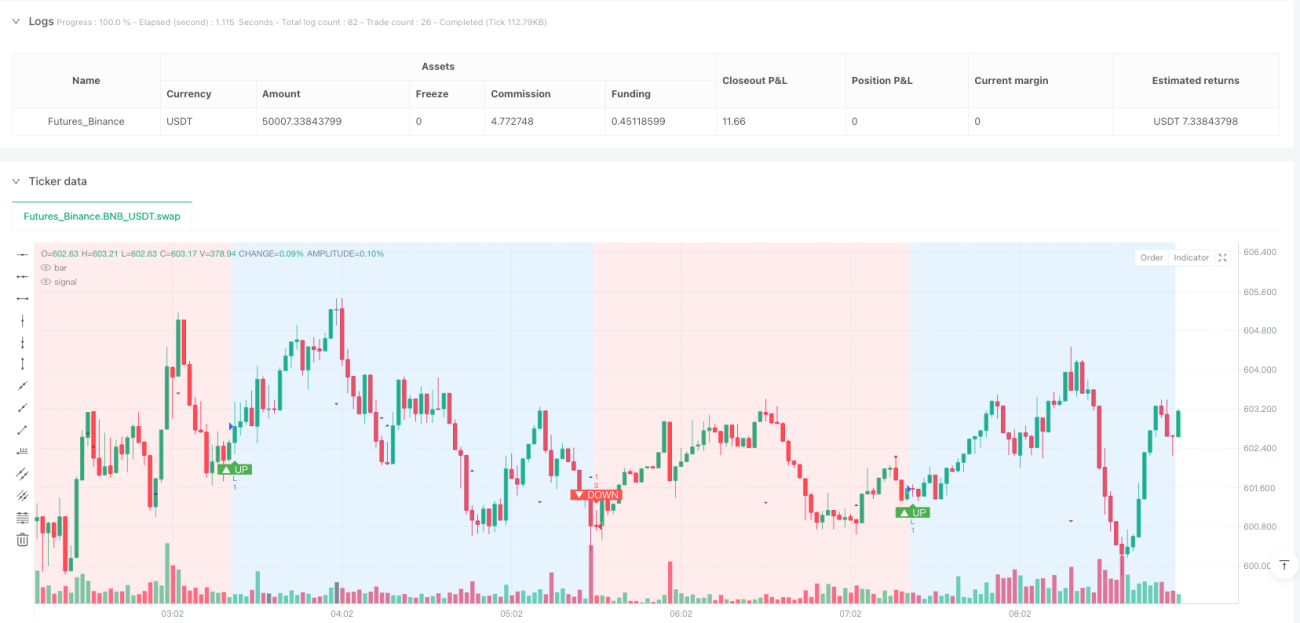
- Visualisasi Arah Aliran: Memaparkan arah arah aliran secara intuitif melalui warna latar belakang dan penanda, memudahkan pedagang memahami keadaan pasaran dengan cepat.
- Latensi Rendah: Berbanding dengan strategi purata bergerak tradisional, kaedah ini boleh bertindak balas terhadap perubahan arah aliran dengan lebih pantas.
Risiko Strategi
- Risiko Ketinggalan: Disebabkan penggunaan pengesanan titik perubahan, strategi ini mempunyai risiko ketinggalan yang wujud dan mungkin tidak dapat menangkap isyarat arah aliran yang paling awal.
- Risiko Pasaran Tidak Menentu: Dalam pasaran dengan turun naik yang tidak jelas, perubahan harga kecil yang kerap boleh menyebabkan dagangan yang tidak diperlukan.
- Kepekaan Parameter: Pemilihan parameter
pivotLookbackmemberi kesan yang ketara terhadap prestasi strategi dan memerlukan pelarasan untuk pasaran dan jangka masa yang berbeza. - Kos Dagangan: Dagangan yang kerap boleh menyebabkan kos transaksi yang tinggi, terutamanya dengan kadar komisen yang lebih tinggi.
Hala Tuju Pengoptimuman Strategi
- Memperkenalkan Penapis Tambahan: Menggabungkan penunjuk kekuatan arah aliran (seperti ATR) untuk menapis isyarat arah aliran yang lemah.
- Pelarasan Parameter Dinamik: Membangunkan mekanisme parameter
pivotLookbacksuai yang berdasarkan kebolehubahan pasaran. - Pengesahan Pelbagai Jangka Masa: Mengesahkan isyarat arah aliran secara silang pada jangka masa yang berbeza untuk meningkatkan kebolehpercayaan isyarat.
- Peningkatan Pembelajaran Mesin: Meneroka penggunaan algoritma pembelajaran mesin untuk mengoptimumkan pengecaman arah aliran dan pemasaan kemasukan.
- Pengoptimuman Pengurusan Risiko: Melaraskan jarak henti rugi dan ambil untung secara dinamik berdasarkan kebolehubahan pasaran.
Kesimpulan
Strategi Momentum Suai Trend Teori Dow ialah kaedah penjejakan arah aliran yang berkuasa. Melalui teknik analisis titik perubahan yang inovatif, ia menyediakan alat pengenalpastian arah aliran yang sistematik untuk pedagang. Walaupun terdapat beberapa risiko yang wujud, fleksibiliti dan sifat dinamiknya menjadikannya pendekatan yang bernilai dalam kalangan strategi dagangan kuantitatif moden. Kejayaan penggunaan strategi ini memerlukan pemahaman mendalam tentang cara ia berfungsi, serta pengoptimuman dan pelarasan berterusan berdasarkan persekitaran pasaran khusus.
- Perkenalkan Penapis Tambahan: Gabungkan penunjuk kekuatan trend (seperti ATR) untuk menapis isyarat trend yang lemah.
- Pelarasan Parameter Dinamik: Bangunkan mekanisme parameter pivotLookback adaptif berdasarkan turun naik pasaran.
- Pengesahan Jangka Masa Pelbagai: Sahkan silang isyarat trend merentasi jangka masa yang berbeza untuk meningkatkan kebolehpercayaan isyarat.
- Peningkatan Pembelajaran Mesin: Terokai penggunaan algoritma pembelajaran mesin untuk mengoptimumkan pengenalpastian trend dan pemasaan masuk.
- Pengoptimuman Pengurusan Risiko: Laraskan jarak henti rugi dan ambil untung secara dinamik berdasarkan turun naik pasaran.
Kesimpulan
Strategi Momentum Adaptif Trend Teori Dow ialah kaedah mengikut trend yang berkuasa, menyediakan pedagang alat pengenalpastian trend yang sistematik melalui teknik analisis titik perubahan yang inovatif. Walaupun terdapat beberapa risiko yang wujud, fleksibiliti dan dinamismenya menjadikannya pendekatan yang bernilai dalam strategi perdagangan kuantitatif moden. Kejayaan mengaplikasikan strategi ini memerlukan pemahaman yang mendalam tentang prinsip kerjanya dan pengoptimuman serta pelarasan berterusan berdasarkan persekitaran pasaran tertentu.
/*backtest
start: 2025-03-29 00:00:00
end: 2025-03-30 09:00:00
period: 2m
basePeriod: 2m
exchanges: [{"eid":"Futures_Binance","currency":"BNB_USDT"}]
*/

//@version=5
// strategy(title="Dow Theory Trend Strategy v3", shorttitle="Dow Trend Strat v3", overlay=true,
//      initial_capital=10000, default_qty_type=strategy.percent_of_equity, default_qty_value=10,
// commission_type=strategy.commission.percent, commission_value=0.1, // Example strategy settings with commission- 1