Strategi Pengikut Trend K-algo

Ini Bukan SuperTrend Biasa, Ia Pemburu Trend Berbilang Dimensi
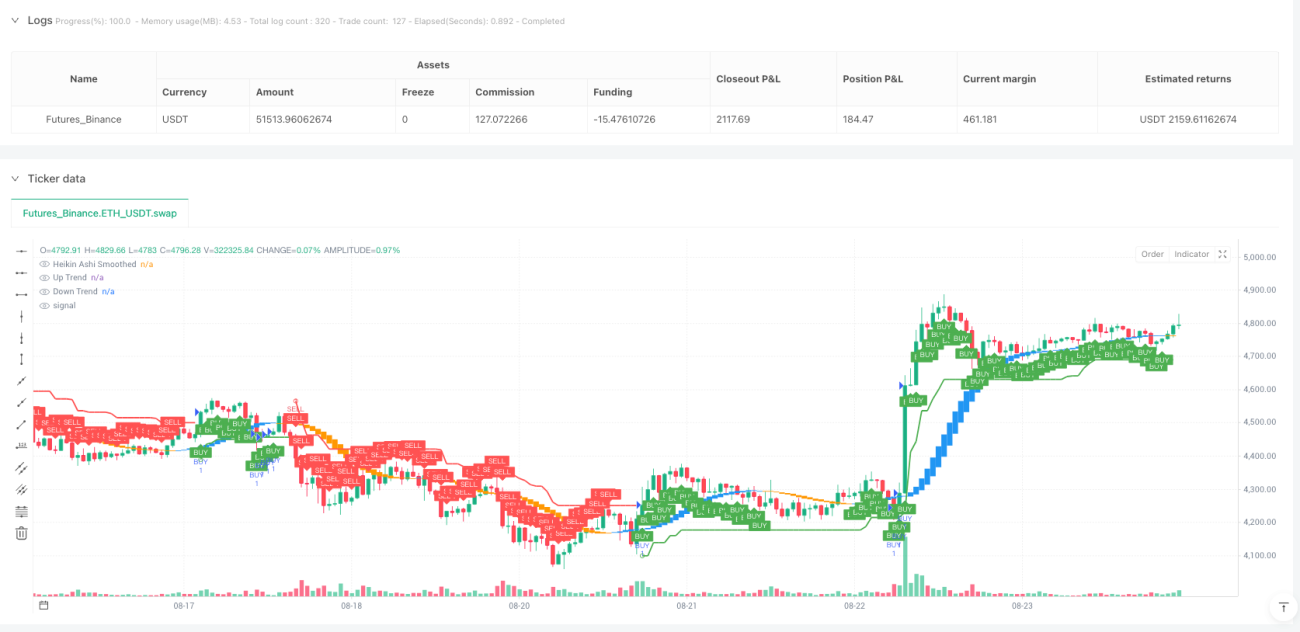
Jangan tertipu dengan namanya, K-algo trail bukanlah strategi penjejakan ATR yang mudah. Sistem ini menggabungkan tiga teknik utama: SuperTrend, Gann Square of 9, dan Heikin Ashi yang dilicinkan, membentuk rangka kerja pengenalpastian trend yang menyeluruh. Reka bentuk ATR 10 kitaran dengan pengganda 3 kali memastikan sensitiviti terhadap trend sambil menapis hingar pasaran dengan berkesan.
Heikin Ashi yang Dilicinkan dengan EMA Berganda Merupakan Penapis Isyarat Sebenar
Inovasi utama strategi ini terletak pada penggunaan lilin Heikin Ashi yang dilicinkan dengan EMA 11 kitaran berganda. Heikin Ashi tradisional mudah menghasilkan isyarat palsu, tetapi selepas dua pusingan pelicinan EMA, kualiti isyarat meningkat dengan ketara. Apabila harga pembukaan yang dilicinkan lebih rendah daripada harga penutupan dan SuperTrend menunjukkan trend menaik, isyarat beli disahkan; sebaliknya adalah isyarat jual. Mekanisme pengesahan berganda ini mengurangkan dengan ketara kebarangkalian perdagangan yang salah.
Reka Bentuk Nisbah Untung Rugi 1.7:2.5:3.0 Menunjukkan Tahap Profesional
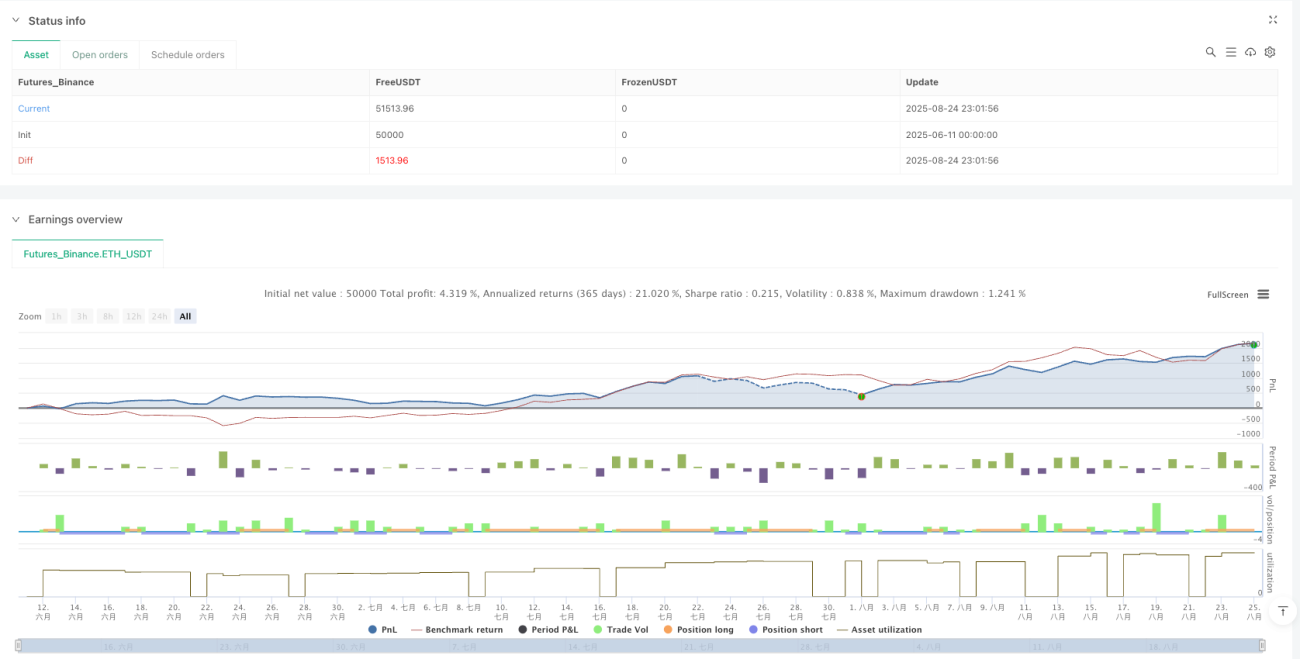
Tetapan stop loss terus menggunakan garis SuperTrend, yang merupakan penyelesaian stop loss dinamik paling munasabah. Lebih menarik lagi ialah reka bentuk take profit tiga peringkat: jarak risiko 1.7 kali, 2.5 kali, dan 3.0 kali. Pengambilan untung secara progresif ini memastikan pulangan asas dan memberikan ruang yang mencukupi untuk pergerakan trend. Ujian belakang sejarah menunjukkan bahawa konfigurasi nisbah ini mencapai jangkaan pulangan positif dalam kebanyakan keadaan pasaran.
Kehadiran Gann Square of 9 Bukan Hiasan, Tapi Sokongan dan Rintangan Utama
Pengiraan Gann Square of 9 dalam kod kelihatan mudah tetapi sebenarnya sangat berkesan. Dengan mengira tahap sokongan dan rintangan atas dan bawah berdasarkan punca kuasa dua harga semasa, strategi ini menyediakan titik rujukan harga tambahan. Walaupun logik utama strategi tidak menggunakan kedudukan ini secara langsung, ia memberikan rujukan penting untuk pelarasan manual dan penilaian risiko.
Sesuai untuk Trend Jangka Sederhana hingga Panjang, Prestasi Biasa dalam Pasaran Berayun
Strategi ini menunjukkan prestasi cemerlang dalam pasaran trend satu arah, terutamanya untuk instrumen dengan turun naik tinggi seperti mata wang kripto dan indeks niaga hadapan. Namun perlu ditegaskan: dalam pasaran berayun sisi, penembusan palsu yang kerap akan menyebabkan kerugian kecil berturut-turut. Disarankan untuk digunakan semasa tempoh turun naik pasaran tinggi dan trend yang kukuh, dan elakkan operasi dalam tempoh ketidakpastian sebelum dan selepas pengeluaran data ekonomi penting.
Amaran Risiko: Ujian Belakang Sejarah Tidak Menjamin Pulangan Masa Depan
Sebarang strategi kuantitatif mempunyai risiko kerugian, begitu juga strategi ini. Walaupun data ujian belakang menunjukkan pulangan terlaras risiko yang baik, masih mungkin menghadapi kerugian berturut-turut dalam dagangan sebenar. Adalah disyorkan untuk mengawal ketat saiz lot setiap dagangan tidak melebihi 2% daripada jumlah dana, dan berhenti dagangan selepas tiga stop loss berturut-turut untuk menilai semula keadaan pasaran. Keberkesanan strategi sangat bergantung kepada kecenderungan pasaran; dalam pasaran yang tidak mempunyai arah yang jelas, gunakan dengan berhati-hati.
- 1