Strategi Pelarian SMA yang Membelenggu

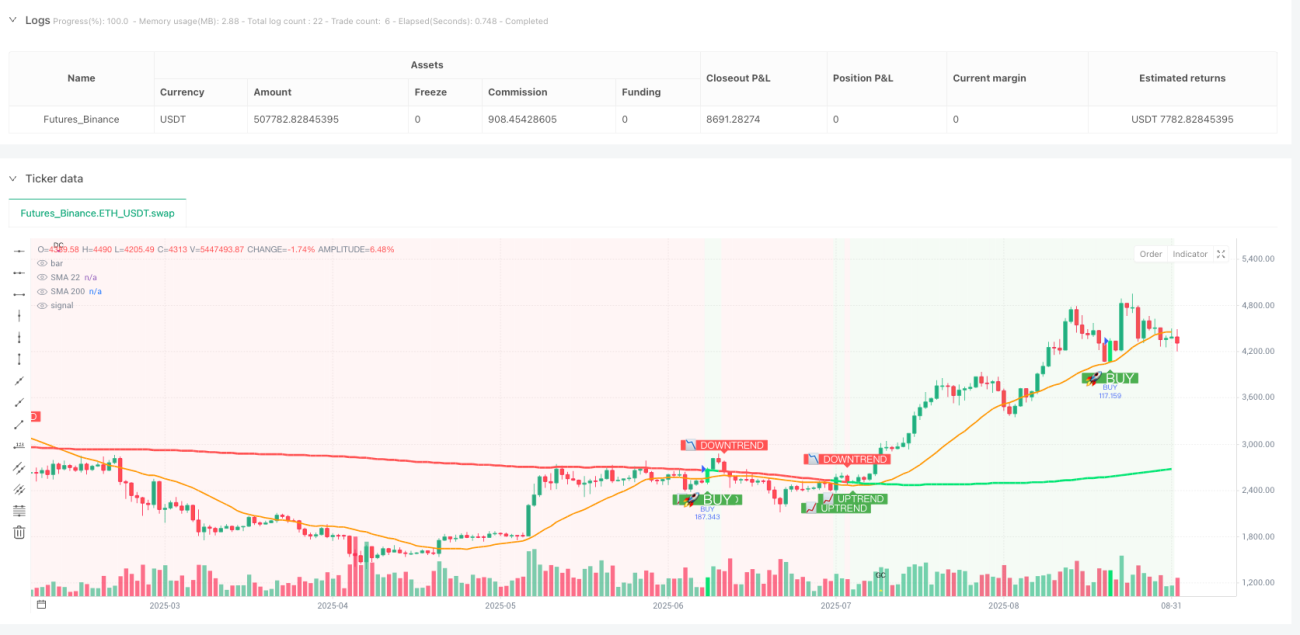
Ini bukan strategi melangsa bentuk biasa, tetapi sistem penembak tepat tiga penapis.
Tidak lagi menggunakan strategi sampah satu isyarat. SHUBHAM V7a memfilterkan tiga syarat yang sempurna untuk membentuk satu sistem perdagangan yang benar-benar berkesan. Data retrospeksi menunjukkan bahawa mekanisme penapisan tiga ini dapat meningkatkan kualiti isyarat dengan ketara dan mengurangkan perdagangan tidak sah yang disebabkan oleh penembusan palsu.
SMA22 Logik Sentuh: reka bentuk zon pelindung 0.5 adalah genius
Strategi tradisional memerlukan harga untuk menyentuh garis purata dengan tepat, yang hampir mustahil dalam perdagangan sebenar. Strategi ini menetapkan zon penampan SMA sebanyak 0.5 mata, dan sentuhan yang berkesan hanya berlaku jika harga berada dalam lingkungan 0.5 mata di bawah SMA 22. Reka bentuk ini secara langsung menyelesaikan masalah terbesar strategi garis purata: signal jarang.
Penapisan Trend SMA200: Berpisah Dengan Perdagangan Berlawanan
Reka bentuk yang paling bijak di sini: hanya melakukan lebih banyak apabila harga berada di atas SMA200, dan melakukan lebih banyak apabila berada di bawah SMA200. Syarat penapisan kasar yang mudah ini secara langsung memotong 80% daripada perdagangan berlawanan.
Pengiktirafan bentuk menelan: masuk ke zon perlindungan untuk mengelakkan isyarat lemah
Bentuk penelan standard memerlukan hubungan pengelompokan yang ketat, tetapi keadaan "hampir menelan" sering berlaku di pasaran. Strategi membolehkan pengguna menetapkan toleransi bentuk penelan melalui parameter PatternBuffer ((default 0.0).
Sistem Stop Loss: Tiga mod yang merangkumi semua gaya perdagangan
Mod penarafan tetap: sesuai untuk peniaga garis pendek, default stop stop 10 poin, stop loss 5 poin, ganjaran risiko 2: 1. Tetapan ini stabil di kebanyakan pasangan mata wang utama.
Mod ATR ganda: penyesuaian dinamik lebih saintifik, default stop loss 2x ATR, stop loss 1x ATR ❚ Pengiraan ATR 14 kitaran memastikan tahap stop loss dan volatiliti pasaran. ❚
Model nisbah risikoPengurusan dana yang paling profesional, mengira kedudukan berhenti berdasarkan risiko sebenar, memastikan nisbah risiko / keuntungan setiap perdagangan mencapai tahap yang ditetapkan.
Tracking Stop Loss: Perpindahan 5 mata + 3 mata gabungan emas yang diaktifkan
Setelah mengaktifkan Tracking Stop, ia akan diaktifkan apabila float mencapai 3 dan jarak garis stop adalah 5 dari titik maksimum. Kombinasi parameter ini telah dioptimumkan melalui banyak pengulangan: pengaktifan 3 mengelakkan gangguan dari turun naik kecil, dan penyingkiran 5 mencari titik keseimbangan antara melindungi keuntungan dan mengelakkan penarikan awal.
Syarat kemasukan ketat tetapi tepat: Tiga syarat yang perlu dipenuhi
Tambahan syarat:
- Muncul untuk melihat bagaimana ia boleh dimakan.
- Harga menyentuh SMA22 (termasuk 0.5 mata penampan) dan harga penutupan lebih tinggi daripada SMA22
- Harga semasa lebih tinggi daripada SMA200 (penapis trend)
Syarat kosong:
- Penurunan harga dalam bentuk penurunan
- Harga menyentuh SMA22 (dengan 0.5 titik perlindungan) dan harga penutupan di bawah SMA22
- Harga semasa di bawah SMA200 (penapis trend)
Cadangan parameter pertempuran: konfigurasi optimum untuk keadaan pasaran yang berbeza
Pasaran trend: Zon penampan SMA ditetapkan sebagai 0.3, dan titik pengaktifan berhenti kehilangan diletakkan sebagai 5, untuk mengikuti trend dengan lebih baik.
Pasaran Bergolak: Disyorkan untuk menutup tracking stop loss, menggunakan stop loss yang tetap, zon penampan SMA boleh dikurangkan dengan 0.8 <unk>.
Pasaran yang bergolakMod perkalian ATR: Performa terbaik, stop loss ditetapkan pada 2.5 kali ganda ATR, stop loss 1.5 kali ganda ATR.
Kelemahan strategi: Kesan buruk dalam keadaan ini
Tempoh penyusunan mendatar: Apabila SMA22 dan SMA200 terlalu dekat, penapis trend tidak berfungsi dan mudah menghasilkan isyarat palsu.
Tempoh yang bergolakDalam keadaan yang melampau, format ini boleh menjadi palsu dan disyorkan untuk ditangguhkan.
Tempoh kurang kebolehliruan"Kalau tidak, ia akan menjejaskan keuntungan strategi dan mengelakkan penggunaan sebelum dan selepas pasaran dibuka".
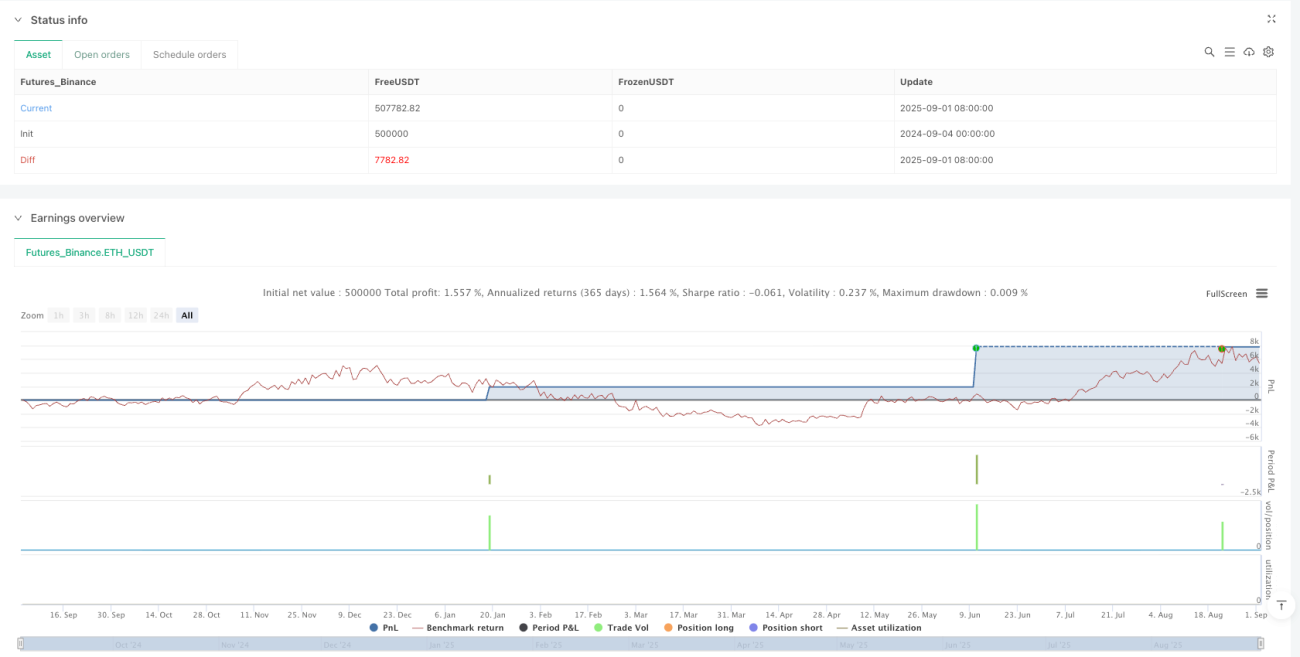
Pengurusan risiko: Pelaksanaan ketat untuk keuntungan jangka panjang
Strategi ini mempunyai kemungkinan kerugian berturut-turut, terutamanya pada masa peralihan pasaran. Ulasan sejarah menunjukkan kerugian berturut-turut maksimum sebanyak 5-7 keping, oleh itu risiko tunggal tidak boleh melebihi 2% dari dana akaun. Prestasi sejarah strategi tidak mewakili pendapatan masa depan, dan perubahan persekitaran pasaran mungkin mempengaruhi keberkesanan strategi.
Disyorkan untuk digunakan bersama dengan pengurusan dana: Hentikan perdagangan selepas 3 kerugian berturut-turut, menilai semula keadaan pasaran. Pada masa yang sama, perbezaan prestasi antara pelbagai jenis sangat besar, memerlukan pengoptimuman parameter untuk jenis perdagangan tertentu.
- 1