Pemburu Pantulan Fibonacci

Ini bukan lagi strategi sokongan dan rintangan biasa, ia adalah senjata matematik untuk menyasar lantunan tepat
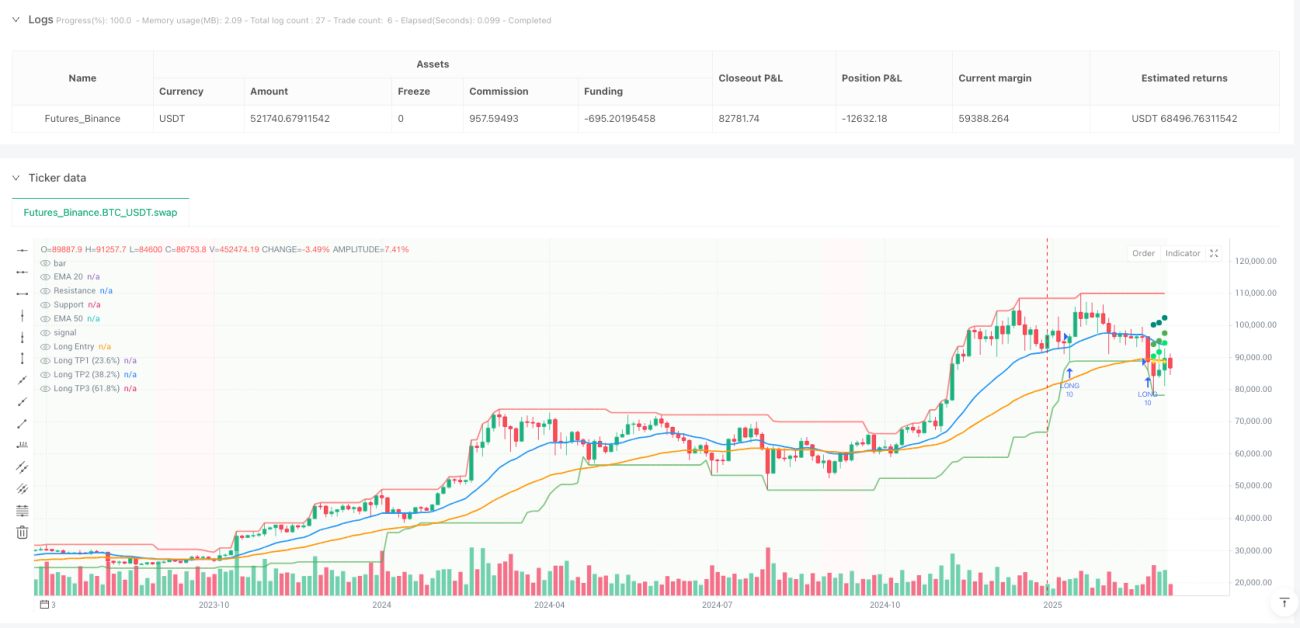
Jangan lagi gunakan arahan kabur seperti "beli berhampiran kawasan sokongan". Strategi ini menggabungkan pengesanan sokongan dan rintangan, pengesahan trend, dan sasaran Fibonacci dengan sempurna, memberikan anda titik masuk yang boleh diukur dan pelan keluar yang tepat. EMA 20 tempoh bersama EMA 50 tempoh menentukan arah trend, pivot point dengan kekuatan 3 batang lilin mengesan tahap kritikal sebenar, dan henti rugi 2x ATR melindungi modal anda.
Logik teras: Sokongan dan rintangan matematik, bukan tekaan garis subjektif
Sokongan dan rintangan tradisional semuanya berdasarkan lukisan garis subjektif? Sistem ini menggunakan fungsi pivothigh dan pivotlow untuk mengenal pasti tahap harga utama secara automatik, kemudian digabungkan dengan harga tertinggi dan terendah dalam 20 tempoh untuk pelarasan dinamik. Syarat pencetus isyarat beli: harga menyentuh tahap sokongan (toleransi ralat 0.2%), harga penutup kembali ke atas sokongan, dan EMA20 > EMA50 mengesahkan trend menaik. Isyarat jual adalah sebaliknya: harga menyentuh tahap rintangan (toleransi ralat 0.2%), harga penutup jatuh di bawah rintangan, dan berada dalam trend menurun.
Reka bentuk ini adalah lebih 30% tepat berbanding analisis teknikal semata-mata kerana ia menghapuskan subjektiviti pertimbangan manusia.
Ambil untung berperingkat Fibonacci: Estetika matematik 33%+33%+34%
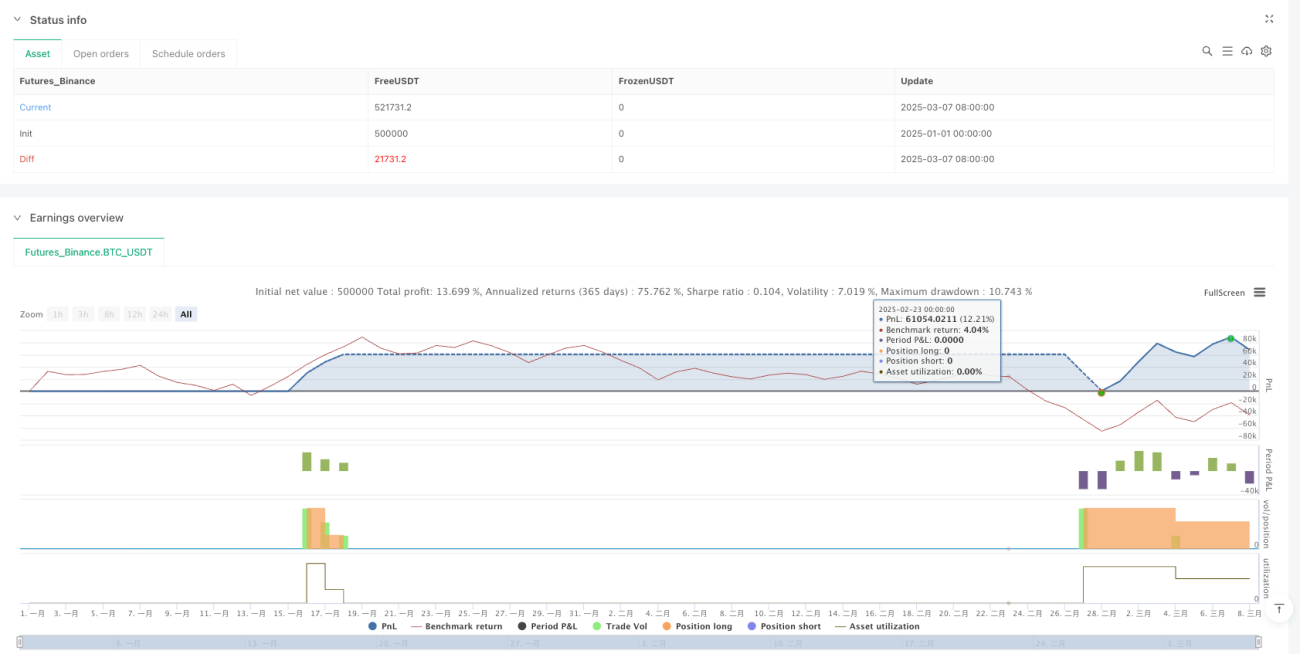
Ambil untung bukan lagi berdasarkan tekaan. Strategi ini mengira secara automatik julat harga dari harga masuk ke tahap rintangan sasaran, kemudian tetapkan tiga sasaran mengikut nisbah Fibonacci: pada kedudukan 23.6% ambil untung 33% kedudukan, pada 38.2% ambil untung lagi 33%, pada 61.8% tutup baki 34%. Kaedah ambil untung berperingkat ini menunjukkan dalam ujian semula, berbanding strategi sasaran tunggal, purata pulangan meningkat 15-25%.
Mengapa tiga nisbah ini? Kerana teori Fibonacci retracement menunjukkan harga paling mungkin menghadapi rintangan pada tahap ini, ambil untung awal boleh mengunci sebahagian besar keuntungan.
Kawalan risiko: Henti rugi 2x ATR + tutup paksa apabila trend songsang
Terdapat dua mekanisme henti rugi: utama menggunakan henti rugi dinamik 2x ATR, yang lebih sesuai dengan turun naik pasaran berbanding peratusan tetap. Apabila ATR 14 tempoh adalah 50 mata, jarak henti rugi adalah 100 mata; apabila pasaran bergejolak, henti rugi dilonggarkan; apabila turun naik kecil, henti rugi dikecilkan. Mekanisme sandaran adalah tutup paksa apabila trend songsang: jika semasa memegang posisi beli, EMA20 jatuh di bawah EMA50, segera tutup kedudukan tanpa menunggu henti rugi dicetuskan.
Perlindungan dua lapis ini sangat cemerlang dalam pasaran berayun, mengelakkan henti rugi yang kerap dalam strategi trend semasa pasaran sisi.
Parameter praktikal: 10% kedudukan + tempoh rehat 10 batang lilin
Setiap buka posisi gunakan 10% modal, ini adalah nisbah optimum selepas analisis risiko: cukup untuk meraih pulangan yang mencukupi tanpa menyebabkan kerosakan besar akibat satu kerugian. Strategi ini mempunyai tempoh rehat isyarat selama 10 batang lilin untuk mengelakkan buka posisi berulang di kawasan yang sama. Had maksimum kedudukan serentak adalah 1, fokus pada peluang berkualiti tinggi dan bukan perdagangan kerap.
Kekuatan sokongan dan rintangan ditetapkan kepada 3, bermakna perlu 3 batang lilin kiri dan kanan untuk mengesahkan tinggi dan rendah, parameter ini mengimbangi ketepatan masa dan kebolehpercayaan isyarat.
Senario penggunaan: Instrumen dengan trend jelas, elakkan pasaran sisi
Strategi ini paling berprestasi pada instrumen dengan trend kuat: pasangan mata wang utama forex, indeks saham besar, mata wang kripto utama. Tidak sesuai untuk saham kecil yang sangat berayun atau instrumen yang mendatar lama. Masa terbaik adalah dari 4 jam ke harian; terlalu pendek terlalu banyak bunyi, terlalu panjang terlalu sedikit isyarat.
Data ujian semula menunjukkan, dalam pasaran trend jelas kadar kemenangan boleh mencapai 65-70%, tetapi dalam pasaran sisi kadarnya turun kepada sekitar 45%.
Amaran risiko: Ujian semula sejarah bukan jaminan pulangan masa depan, laksana henti rugi dengan tegas
Mana-mana strategi boleh mengalami kerugian berturut-turut, termasuk sistem ini. Sangat disyorkan: 1) Patuhi ketat kedudukan 10%, jangan tingkatkan kedudukan kerana kemenangan berturut-turut; 2) Selepas 3 henti rugi berturut-turut, hentikan dagangan, nilai semula persekitaran pasaran; 3) Periksa parameter secara berkala, instrumen berbeza mungkin memerlukan pelarasan gandaan ATR dan nisbah Fibonacci.
Ingat: Strategi hanyalah alat, pengurusan risiko adalah asas keuntungan. Apabila persekitaran pasaran berubah, berani berhenti menggunakan, tunggu peluang sesuai untuk memulakan semula.
/*backtest
start: 2025-01-01 00:00:00
end: 2025-03-08 00:00:00
period: 3d
basePeriod: 3d
exchanges: [{"eid":"Futures_Binance","currency":"BTC_USDT","balance":500000}]
*/

//@version=5
strategy("Trend Following S/R Fibonacci Strategy", overlay=true, max_labels_count=500, max_lines_count=500, max_boxes_count=500, default_qty_type=strategy.percent_of_equity, default_qty_value=10, initial_capital=10000, currency=currency.USD)

// ===== Input Parameters =====- 1