Robot Pelaburan Berkala Pintar

🤖 Ini Bukanlah DCA Biasa - Ini Robot DCA yang Berfikir!
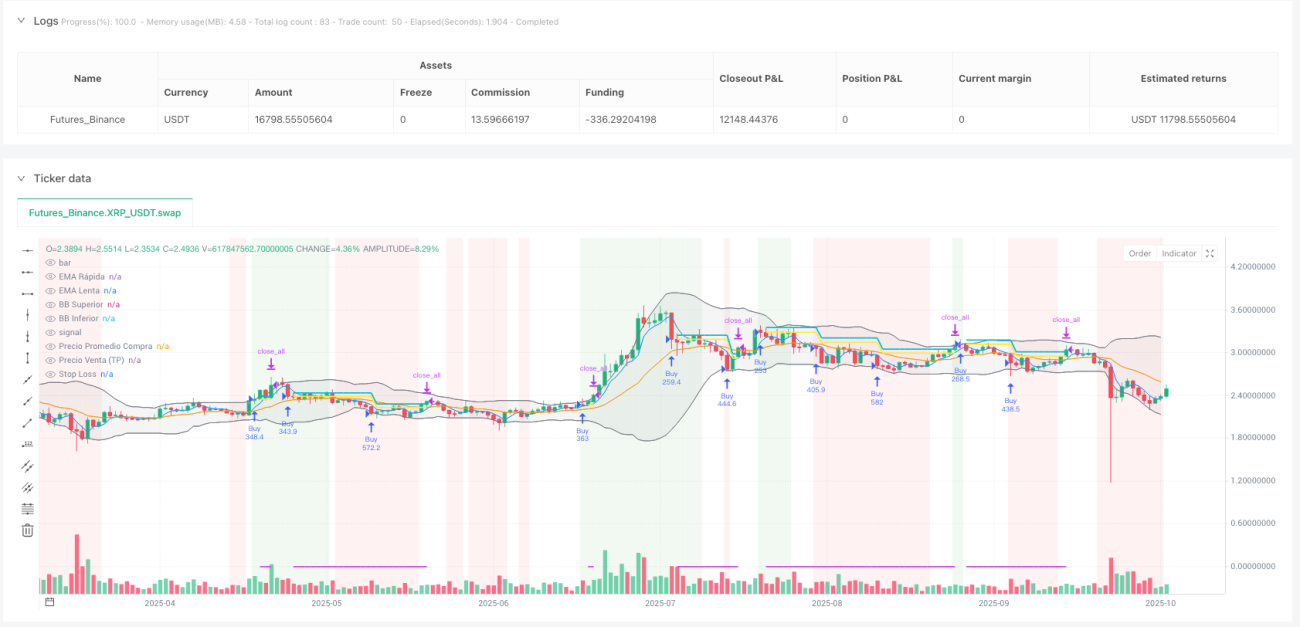
Tahukah anda? Kebanyakan orang melakukan pelaburan berkala (DCA) seperti "beli beli beli tanpa fikir", tetapi strategi ini bagaikan anda mendapat pembantu pelaburan yang sangat pintar! Ia akan menyesuaikan jumlah belian setiap kali mengikut keadaan pasaran, bermula dari 5% dan meningkat secara berperingkat sehingga 100%. Ibarat anda pergi ke pasar borong, beli lebih banyak bila harga murah, beli kurang bila harga mahal. Ringkas, kasar, tetapi sangat berkesan!
📊 Empat Penunjuk Teknikal Bergabung, Trend Pasaran Jelas Seketika
Titik penting! Strategi ini menggunakan gabungan empat penunjuk teknikal:
- Purata Bergerak EMA Cepat/Lambat: Bagaikan "elektrokardiogram" pasaran, menunjukkan arah trend
- MACD: "Barometer" momentum pasaran, menentukan masa beli/jual
- RSI: "Termometer" terlebih beli/terlebih jual, mengelak kejar harga tinggi dan jual harga rendah
- Jalur Bollinger: "Zon selamat" turun naik harga, menentukan sokongan dan rintangan
Keempat-empat penunjuk ini bergabung seperti membentuk "Avengers", masing-masing menjalankan tugas tetapi saling bekerjasama dengan harmoni!
💡 Logik Penambahan Bijak: Semakin Jatuh Semakin Beli
Panduan mengelak masalah! Masalah terbesar DCA biasa ialah tidak mengawal saiz kedudukan. Strategi ini jauh lebih bijak:
- Belian pertama menggunakan 5% modal untuk mencuba air
- Setiap penambahan meningkatkan pelaburan sebanyak 2.5%
- Semakin banyak harga jatuh, semakin besar jurang antara penambahan (2%, 6%, 10%...)
- Pelaburan tunggal maksimum tidak melebihi 100% daripada jumlah dana
Seperti naik tahap dalam permainan video, semakin ke belakang semakin besar pelaburan, tetapi risiko dikawal ketat!
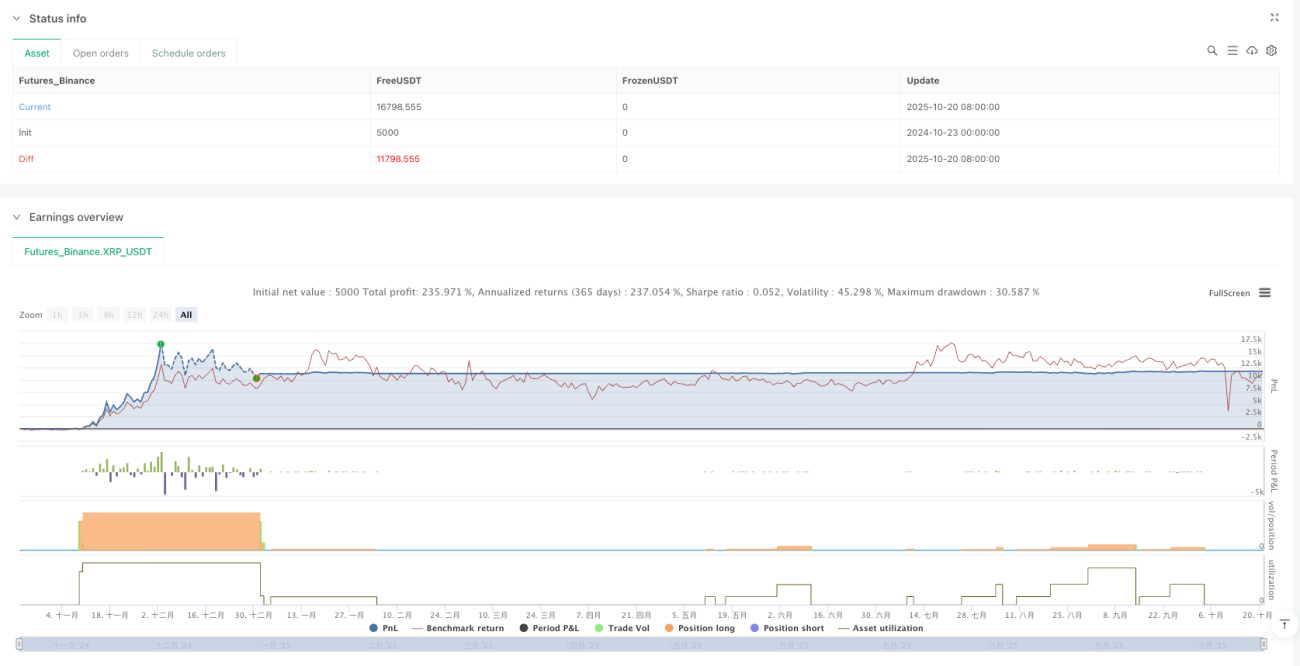
🎯 Ambil Untung dan Henti Rugi yang Bijak, Biarkan Untung Berlari, Biarkan Rugi Berhenti
Logik jualan strategi ini sangat mesra pengguna:
- Keuntungan minimum 2% sebelum pertimbangkan jualan: Tidak mahu jadi "orang bodoh yang bekerja keras tetapi sia-sia"
- Keluar bila trend melemah: Ambil untung semasa boleh, simpan dalam poket
- Penurunan harga 2% mencetus isyarat jual: Lindungi keuntungan daripada pulang semula
- Boleh tetapkan henti rugi: Walaupun lalai 100% (hampir tidak pernah aktif), anda boleh laraskan mengikut toleransi risiko
Ringkasnya, strategi ini adalah "tidak akan lembap bila boleh untung, tidak akan berlengah bila tiba masa untuk lari"!
// This Pine Script™ code is subject to the terms of the MPL 2.0 at https://mozilla.org/MPL/2.0/
// © MTB by Neurodoc
// By Nicolás Astorga

//@version=5
strategy("Master Trading Bot by Neurodoc",
         shorttitle="MTB Adaptation",
         overlay=true,
         initial_capital=10000,
         pyramiding=100,
         commission_value=0.1,
commission_type=strategy.commission.percent,- 1