
"Estratégia Mágica de Média Móvel de EMA Dupla" do YouTube Master
Nesta edição, discutiremos uma "estratégia mágica de média móvel dupla EMA" do YouTube, que é chamada de "assassina do mercado de ações e criptomoedas". Depois de assistir ao vídeo, aprendi que essa estratégia é uma estratégia de linguagem de negociação Pine View, que usa 2 indicadores de negociação. Vendo que os resultados do backtesting no vídeo foram muito bons, e o FMZ também suporta a linguagem Pine do Trading View, não pude deixar de querer fazer o backtest e testar a análise eu mesmo. Então comece a vida toda! Vamos replicar a estratégia do vídeo.
Indicadores utilizados pela estratégia
- Indicador EMA
Para simplificar o design, não usaremos a Média Móvel Exponencial listada no vídeo. Em vez disso, usamos o ta.ema integrado na visualização de negociação (na verdade, eles são os mesmos).
- Indicador Swing Free VuManChu
Este é um indicador no Trading View. Precisamos ir para o Trading View e baixar o código-fonte.
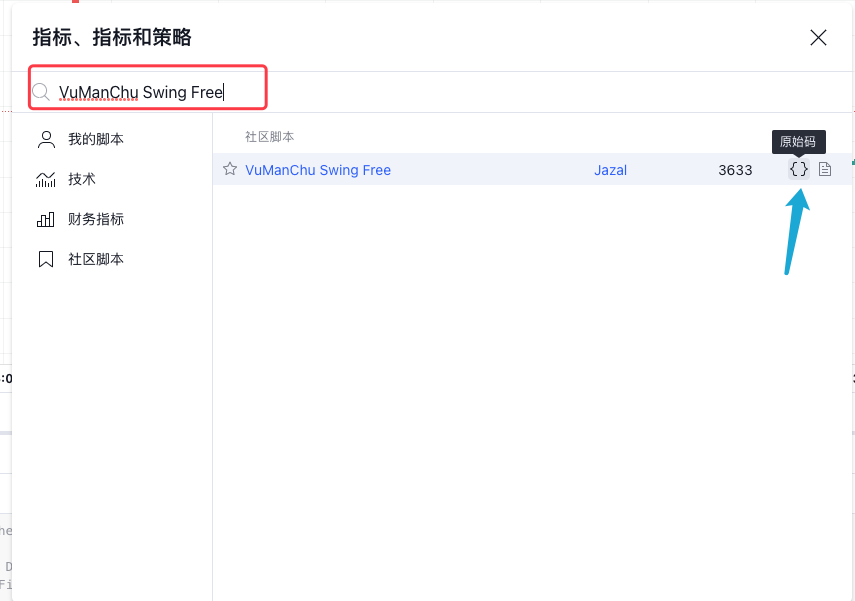
Código gratuito do VuManChu Swing:
pine
// This source code is subject to the terms of the Mozilla Public License 2.0 at https://mozilla.org/MPL/2.0/
// Credits to the original Script - Range Filter DonovanWall https://www.tradingview.com/script/lut7sBgG-Range-Filter-DW/
// This version is the old version of the Range Filter with less settings to tinker with
//@version=4
study(title="Range Filter - B&S Signals", shorttitle="RF - B&S Signals", overlay=true)
//-----------------------------------------------------------------------------------------------------------------------------------------------------------------
//Functions
//-----------------------------------------------------------------------------------------------------------------------------------------------------------------
//Range Size Function
rng_size(x, qty, n)=>
// AC = Cond_EMA(abs(x - x[1]), 1, n)
wper = (n*2) - 1
avrng = ema(abs(x - x[1]), n)
AC = ema(avrng, wper)*qty
rng_size = AC
//Range Filter Function
rng_filt(x, rng_, n)=>
r = rng_
var rfilt = array.new_float(2, x)
array.set(rfilt, 1, array.get(rfilt, 0))
if x - r > array.get(rfilt, 1)
array.set(rfilt, 0, x - r)
if x + r < array.get(rfilt, 1)
array.set(rfilt, 0, x + r)
rng_filt1 = array.get(rfilt, 0)
hi_band = rng_filt1 + r
lo_band = rng_filt1 - r
rng_filt = rng_filt1
[hi_band, lo_band, rng_filt]
//-----------------------------------------------------------------------------------------------------------------------------------------------------------------
//Inputs
//-----------------------------------------------------------------------------------------------------------------------------------------------------------------
//Range Source
rng_src = input(defval=close, type=input.source, title="Swing Source")
//Range Period
rng_per = input(defval=20, minval=1, title="Swing Period")
//Range Size Inputs
rng_qty = input(defval=3.5, minval=0.0000001, title="Swing Multiplier")
//Bar Colors
use_barcolor = input(defval=false, type=input.bool, title="Bar Colors On/Off")
//-----------------------------------------------------------------------------------------------------------------------------------------------------------------
//Definitions
//-----------------------------------------------------------------------------------------------------------------------------------------------------------------
//Range Filter Values
[h_band, l_band, filt] = rng_filt(rng_src, rng_size(rng_src, rng_qty, rng_per), rng_per)
//Direction Conditions
var fdir = 0.0
fdir := filt > filt[1] ? 1 : filt < filt[1] ? -1 : fdir
upward = fdir==1 ? 1 : 0
downward = fdir==-1 ? 1 : 0
//Trading Condition
longCond = rng_src > filt and rng_src > rng_src[1] and upward > 0 or rng_src > filt and rng_src < rng_src[1] and upward > 0
shortCond = rng_src < filt and rng_src < rng_src[1] and downward > 0 or rng_src < filt and rng_src > rng_src[1] and downward > 0
CondIni = 0
CondIni := longCond ? 1 : shortCond ? -1 : CondIni[1]
longCondition = longCond and CondIni[1] == -1
shortCondition = shortCond and CondIni[1] == 1
//Colors
filt_color = upward ? #05ff9b : downward ? #ff0583 : #cccccc
bar_color = upward and (rng_src > filt) ? (rng_src > rng_src[1] ? #05ff9b : #00b36b) :
downward and (rng_src < filt) ? (rng_src < rng_src[1] ? #ff0583 : #b8005d) : #cccccc
//-----------------------------------------------------------------------------------------------------------------------------------------------------------------
//Outputs
//-----------------------------------------------------------------------------------------------------------------------------------------------------------------
//Filter Plot
filt_plot = plot(filt, color=filt_color, transp=67, linewidth=3, title="Filter")
//Band Plots
h_band_plot = plot(h_band, color=color.new(#05ff9b, 100), title="High Band")
l_band_plot = plot(l_band, color=color.new(#ff0583, 100), title="Low Band")
//Band Fills
fill(h_band_plot, filt_plot, color=color.new(#00b36b, 92), title="High Band Fill")
fill(l_band_plot, filt_plot, color=color.new(#b8005d, 92), title="Low Band Fill")
//Bar Color
barcolor(use_barcolor ? bar_color : na)
//Plot Buy and Sell Labels
plotshape(longCondition, title = "Buy Signal", text ="BUY", textcolor = color.white, style=shape.labelup, size = size.normal, location=location.belowbar, color = color.new(color.green, 0))
plotshape(shortCondition, title = "Sell Signal", text ="SELL", textcolor = color.white, style=shape.labeldown, size = size.normal, location=location.abovebar, color = color.new(color.red, 0))
//Alerts
alertcondition(longCondition, title="Buy Alert", message = "BUY")
alertcondition(shortCondition, title="Sell Alert", message = "SELL")
Estratégia Lógica
Indicador EMA: A estratégia usa duas médias móveis EMA, uma linha rápida (parâmetro de ciclo pequeno) e uma linha lenta (parâmetro de ciclo grande). A principal função da média móvel EMA dupla é nos ajudar a determinar a direção das tendências do mercado.
-
Arranjo longo
A linha rápida está acima da linha lenta. -
Arranjo curto
A linha rápida está abaixo da linha lenta.
Indicador VuManChu Swing Free: O indicador VuManChu Swing Free é usado para enviar sinais e, em seguida, combinado com outras condições para determinar se deve ou não fazer uma ordem de negociação. No código-fonte do indicador VuManChu Swing Free, podemos ver que a variável longCondition representa o sinal de compra, e a variável shortCondition representa o sinal de venda. Essas duas variáveis serão usadas ao escrever as condições do pedido posteriormente.
Agora vamos falar sobre as condições específicas de acionamento do sinal de negociação da estratégia:
-
Regras para entrar em posições longas:
O preço de fechamento da linha K positiva deve estar acima da linha rápida da EMA, as duas médias móveis da EMA devem estar em um arranjo de alta (a linha rápida está acima da linha lenta) e o indicador VuManChu Swing Free deve mostrar um sinal de compra (longCondition é verdadeiro). Se as três condições forem atendidas, esta linha K é a linha K chave para entrar em uma posição longa, e o preço de fechamento desta linha K é a posição de entrada. -
Regras para entrar em uma posição curta (oposta a uma posição longa):
O preço de fechamento do candle negativo deve estar abaixo da linha EMA rápida, as duas médias móveis EMA devem estar em uma posição curta (a linha rápida está abaixo da linha lenta) e o indicador VuManChu Swing Free deve mostrar um sinal de venda (shortCondition é verdade). Se as três condições forem atendidas, o preço de fechamento desta linha K é o ponto de entrada curto.
A lógica de negociação não é muito simples? Como o vídeo de origem não especifica o take-profit e o stop-loss, o editor usará um método de take-profit e stop-loss mais moderado, usando um stop loss de ponto fixo e rastreamento ter lucro.
Design de código
Colocamos o código do indicador VuManChu Swing Free diretamente em nosso código de estratégia intacto.
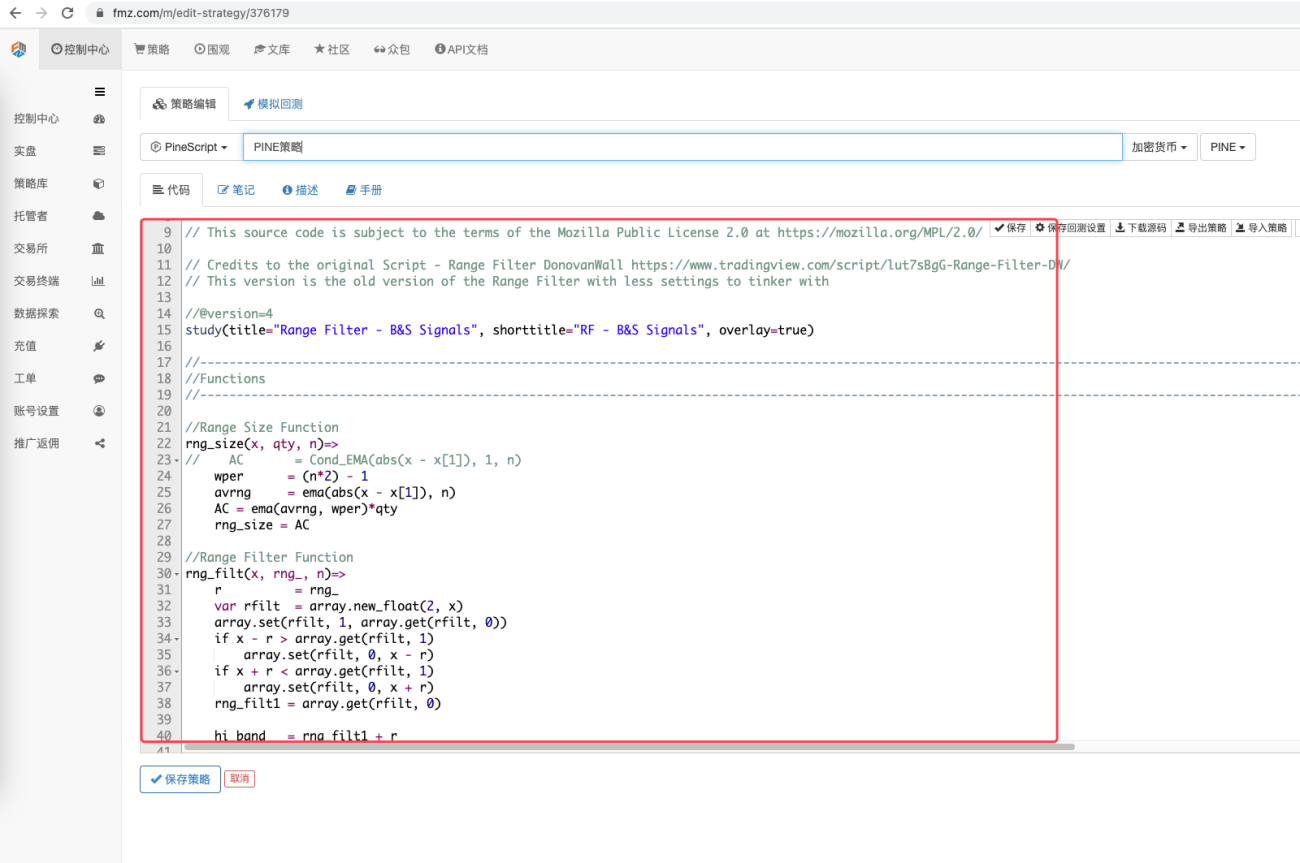
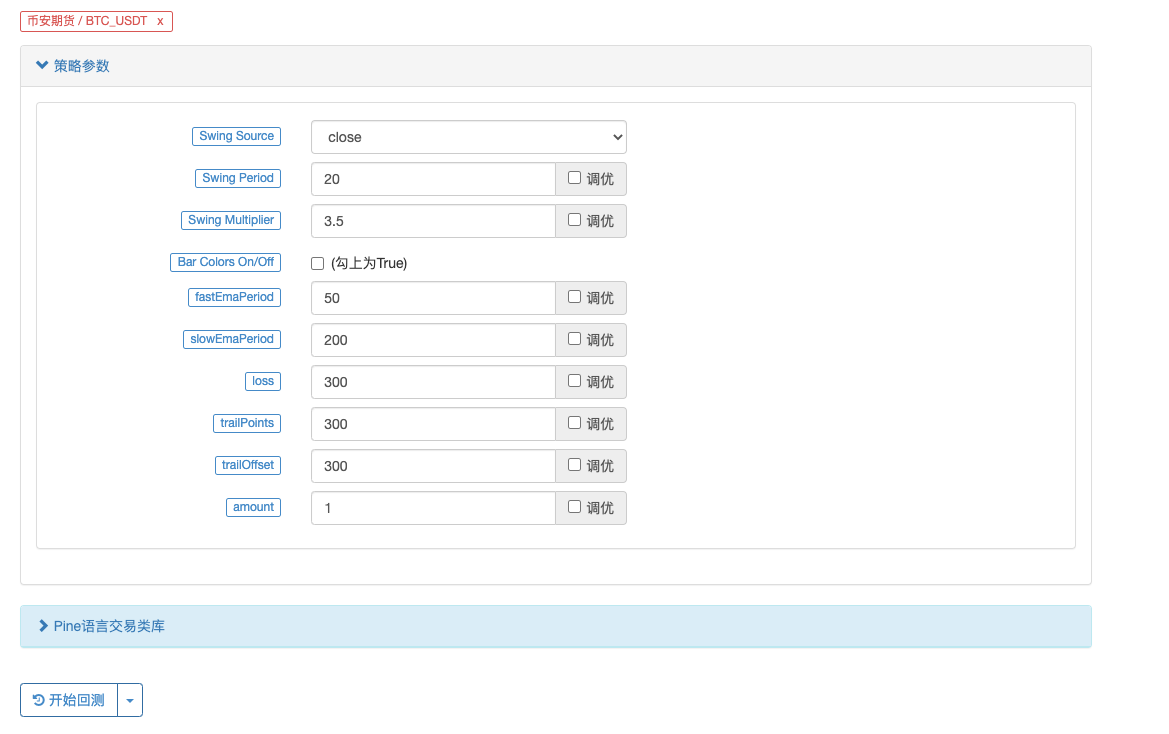
Em seguida, escrevemos um pedaço de código de linguagem Pine para implementar a função de transação:
pine
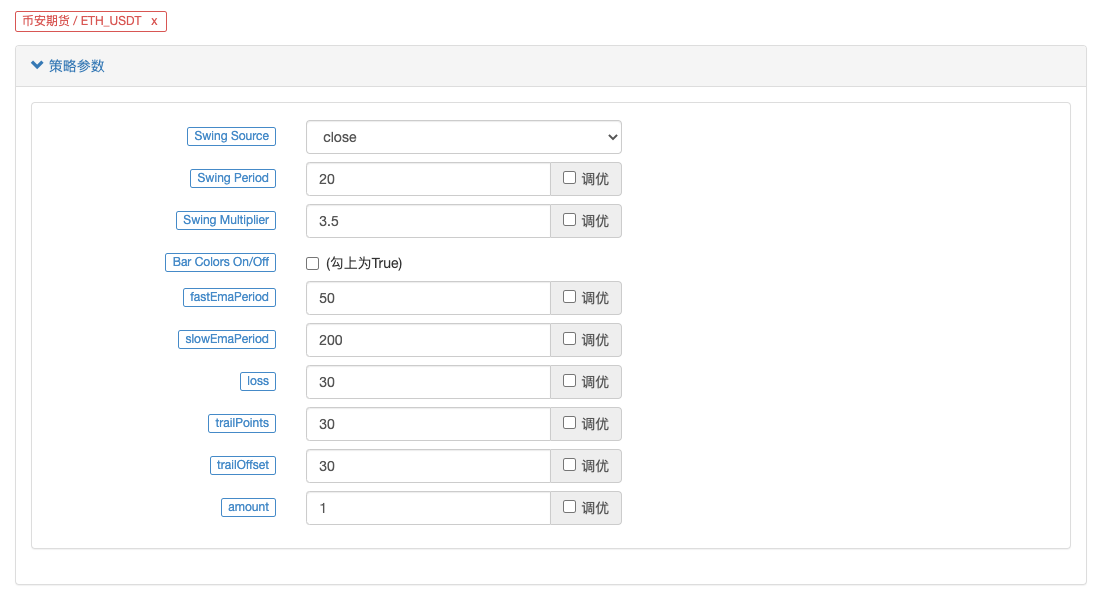
// extend
fastEmaPeriod = input(50, "fastEmaPeriod") // 快线周期
slowEmaPeriod = input(200, "slowEmaPeriod") // 慢线周期
loss = input(30, "loss") // 止损点数
trailPoints = input(30, "trailPoints") // 移动止盈触发点数
trailOffset = input(30, "trailOffset") // 移动止盈偏移量(点数)
amount = input(1, "amount") // 下单量
emaFast = ta.ema(close, fastEmaPeriod) // 计算快线EMA
emaSlow = ta.ema(close, slowEmaPeriod) // 计算慢线EMA
buyCondition = longCondition and emaFast > emaSlow and close > open and close > emaFast // 做多入场条件
sellCondition = shortCondition and emaFast < emaSlow and close < open and close < emaFast // 做空入场条件
if buyCondition and strategy.position_size == 0
strategy.entry("long", strategy.long, amount)
strategy.exit("exit_long", "long", amount, loss=loss, trail_points=trailPoints, trail_offset=trailOffset)
if sellCondition and strategy.position_size == 0
strategy.entry("short", strategy.short, amount)
strategy.exit("exit_short", "short", amount, loss=loss, trail_points=trailPoints, trail_offset=trailOffset)
A. Como você pode ver, quando buyCondition é verdadeiro:
- A variável longCondition é verdadeira (o indicador VuManChu Swing Free envia um sinal para operar comprado).
- emaFast > emaSlow (arranjo de alta da EMA).
- fechar > abrir (indicando que a BAR atual é uma linha positiva), fechar > emaFast (indicando que o preço de fechamento está acima da linha rápida da EMA).
As três condições para operar em longo prazo foram atendidas.
B. Quando sellCondition é verdadeiro, as três condições para venda a descoberto são atendidas (não explicadas aqui).
Então, quando a condição if determinar que o sinal foi acionado, use a função strategy.entry para entrar no mercado e abrir uma posição, e defina a função strategy.exit para stop loss e trailing profit.
Código completo
            pine

            /*backtest
start: 2022-01-01 00:00:00
end: 2022-10-08 00:00:00
period: 15m
basePeriod: 5m
exchanges: [{"eid":"Futures_Binance","currency":"ETH_USDT"}]
args: [["ZPrecision",0,358374]]
*/

// This source code is subject to the terms of the Mozilla Public License 2.0 at https://mozilla.org/MPL/2.0/

// Credits to the original Script - Range Filter DonovanWall https://www.tradingview.com/script/lut7sBgG-Range-Filter-DW/
// This version is the old version of the Range Filter with less settings to tinker with

//@version=4
study(title="Range Filter - B&S Signals", shorttitle="RF - B&S Signals", overlay=true)

//-----------------------------------------------------------------------------------------------------------------------------------------------------------------
//Functions
//-----------------------------------------------------------------------------------------------------------------------------------------------------------------

//Range Size Function
rng_size(x, qty, n)=>
//    AC       = Cond_EMA(abs(x - x[1]), 1, n)
    wper      = (n*2) - 1
    avrng     = ema(abs(x - x[1]), n)
    AC = ema(avrng, wper)*qty
    rng_size = AC

//Range Filter Function
rng_filt(x, rng_, n)=>
    r          = rng_
    var rfilt  = array.new_float(2, x)
    array.set(rfilt, 1, array.get(rfilt, 0))
    if x - r > array.get(rfilt, 1)
        array.set(rfilt, 0, x - r)
    if x + r < array.get(rfilt, 1)
        array.set(rfilt, 0, x + r)
    rng_filt1 = array.get(rfilt, 0)

    hi_band   = rng_filt1 + r
    lo_band   = rng_filt1 - r
    rng_filt  = rng_filt1
    [hi_band, lo_band, rng_filt]

//-----------------------------------------------------------------------------------------------------------------------------------------------------------------
//Inputs
//-----------------------------------------------------------------------------------------------------------------------------------------------------------------

//Range Source
rng_src = input(defval=close, type=input.source, title="Swing Source")

//Range Period
rng_per = input(defval=20, minval=1, title="Swing Period")

//Range Size Inputs
rng_qty   = input(defval=3.5, minval=0.0000001, title="Swing Multiplier")

//Bar Colors
use_barcolor = input(defval=false, type=input.bool, title="Bar Colors On/Off")

//-----------------------------------------------------------------------------------------------------------------------------------------------------------------
//Definitions
//-----------------------------------------------------------------------------------------------------------------------------------------------------------------

//Range Filter Values
[h_band, l_band, filt] = rng_filt(rng_src, rng_size(rng_src, rng_qty, rng_per), rng_per)

//Direction Conditions
var fdir = 0.0
fdir    := filt > filt[1] ? 1 : filt < filt[1] ? -1 : fdir
upward   = fdir==1 ? 1 : 0
downward = fdir==-1 ? 1 : 0

//Trading Condition
longCond = rng_src > filt and rng_src > rng_src[1] and upward > 0 or rng_src > filt and rng_src < rng_src[1] and upward > 0
shortCond = rng_src < filt and rng_src < rng_src[1] and downward > 0 or rng_src < filt and rng_src > rng_src[1] and downward > 0

CondIni = 0
CondIni := longCond ? 1 : shortCond ? -1 : CondIni[1]
longCondition = longCond and CondIni[1] == -1
shortCondition = shortCond and CondIni[1] == 1

//Colors
filt_color = upward ? #05ff9b : downward ? #ff0583 : #cccccc
bar_color  = upward and (rng_src > filt) ? (rng_src > rng_src[1] ? #05ff9b : #00b36b) :
             downward and (rng_src < filt) ? (rng_src < rng_src[1] ? #ff0583 : #b8005d) : #cccccc

//-----------------------------------------------------------------------------------------------------------------------------------------------------------------
//Outputs
//-----------------------------------------------------------------------------------------------------------------------------------------------------------------

//Filter Plot
filt_plot = plot(filt, color=filt_color, transp=67, linewidth=3, title="Filter")

//Band Plots
h_band_plot = plot(h_band, color=color.new(#05ff9b, 100), title="High Band")
l_band_plot = plot(l_band, color=color.new(#ff0583, 100), title="Low Band")

//Band Fills
fill(h_band_plot, filt_plot, color=color.new(#00b36b, 92), title="High Band Fill")
fill(l_band_plot, filt_plot, color=color.new(#b8005d, 92), title="Low Band Fill")

//Bar Color
barcolor(use_barcolor ? bar_color : na)

//Plot Buy and Sell Labels
plotshape(longCondition, title = "Buy Signal", text ="BUY", textcolor = color.white, style=shape.labelup, size = size.normal, location=location.belowbar, color = color.new(color.green, 0))
plotshape(shortCondition, title = "Sell Signal", text ="SELL", textcolor = color.white, style=shape.labeldown, size = size.normal, location=location.abovebar, color = color.new(color.red, 0))

//Alerts
alertcondition(longCondition, title="Buy Alert", message = "BUY")
alertcondition(shortCondition, title="Sell Alert", message = "SELL")


// extend
fastEmaPeriod = input(50, "fastEmaPeriod")
slowEmaPeriod = input(200, "slowEmaPeriod")
loss = input(30, "loss")
trailPoints = input(30, "trailPoints")
trailOffset = input(30, "trailOffset")
amount = input(1, "amount")

emaFast = ta.ema(close, fastEmaPeriod)
emaSlow = ta.ema(close, slowEmaPeriod)

buyCondition = longCondition and emaFast > emaSlow and close > open and close > emaFast
sellCondition = shortCondition and emaFast < emaSlow and close < open and close < emaFast

if buyCondition and strategy.position_size == 0
    strategy.entry("long", strategy.long, amount)
    strategy.exit("exit_long", "long", amount, loss=loss, trail_points=trailPoints, trail_offset=trailOffset)
if sellCondition and strategy.position_size == 0
    strategy.entry("short", strategy.short, amount)
    strategy.exit("exit_short", "short", amount, loss=loss, trail_points=trailPoints, trail_offset=trailOffset)
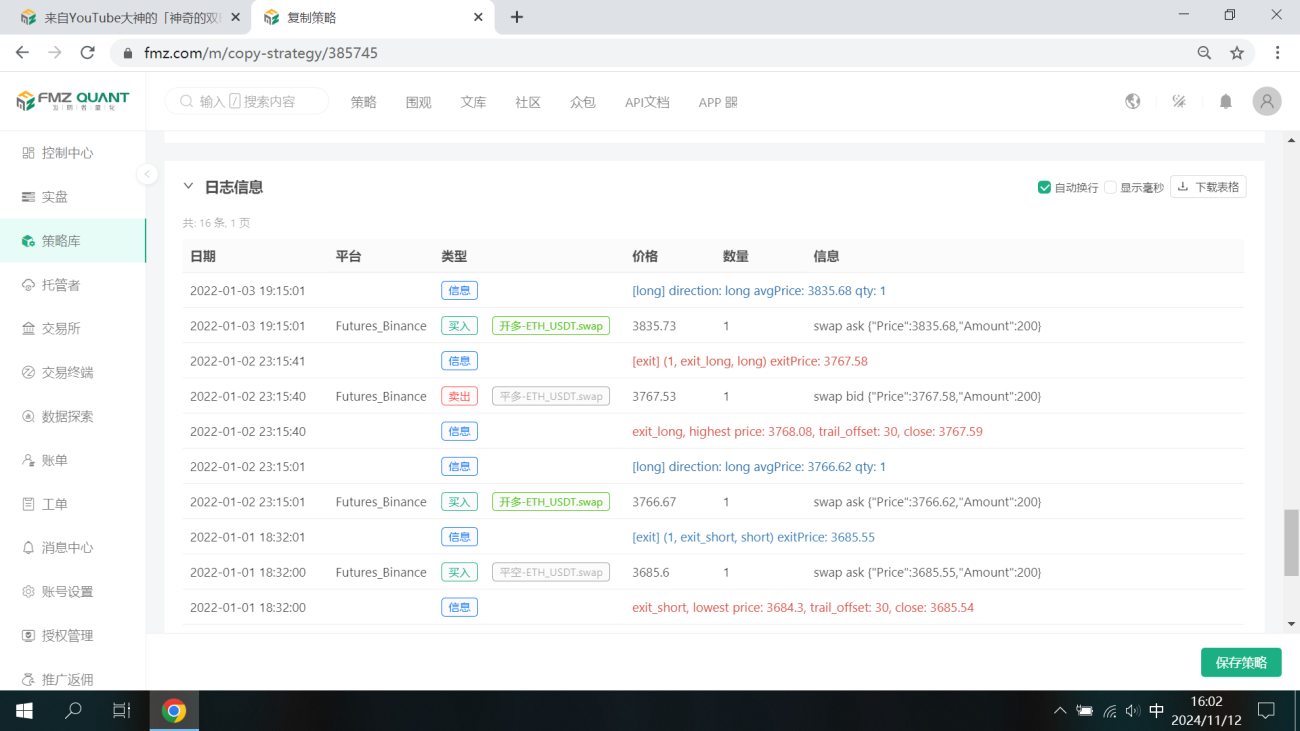
Testes retrospectivos
O intervalo de tempo do backtesting é selecionado de janeiro de 2022 a outubro de 2022, o período da linha K é de 15 minutos e o modelo de preço de fechamento é usado para o backtesting. O mercado escolhe o contrato perpétuo ETH_USDT da Binance. As configurações dos parâmetros são as indicadas no vídeo de origem: 50 períodos para a linha rápida e 200 períodos para a linha lenta, e outros parâmetros permanecem inalterados por padrão. Sou um pouco subjetivo ao definir os pontos de stop loss e trailing profit e apenas os defino em 30 pontos.
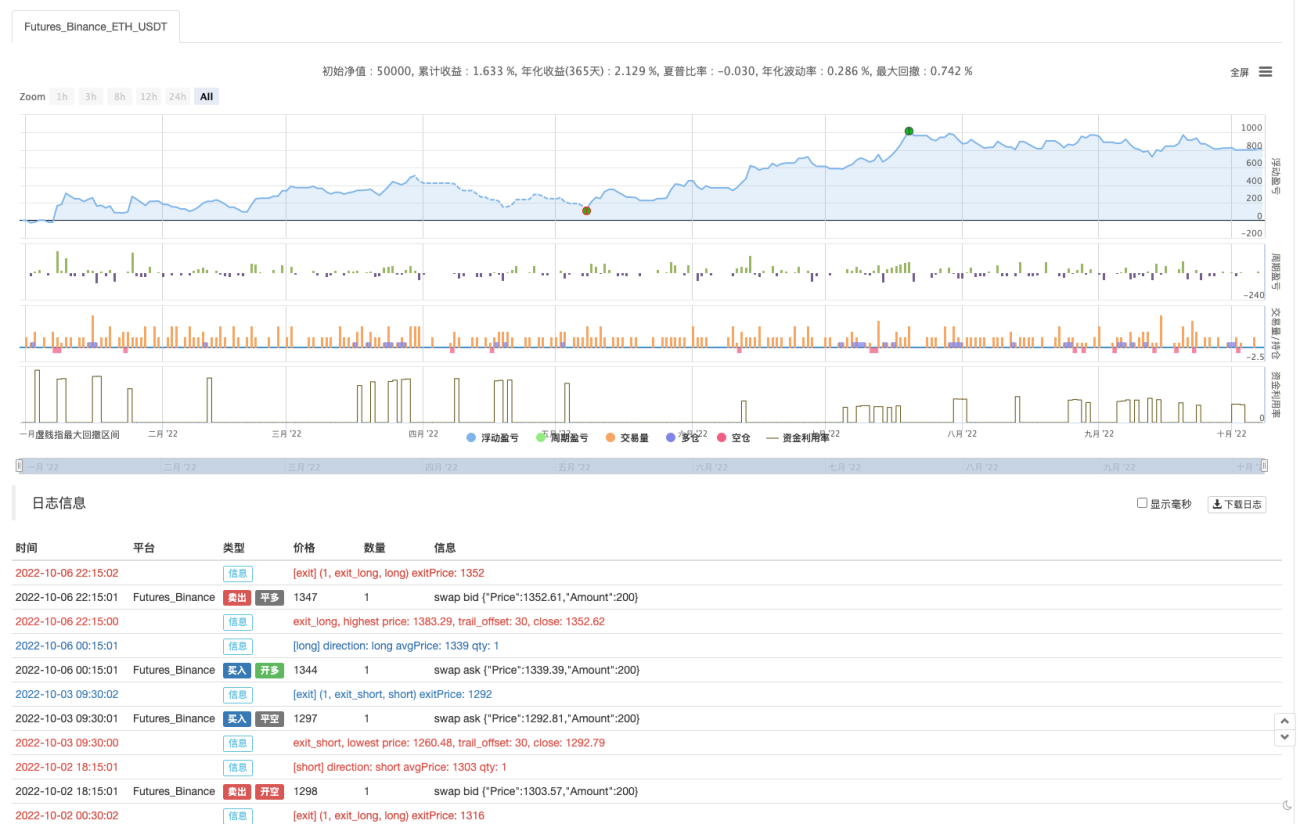
Os resultados do backtest são mais ou menos. Após vários backtests, parece que parâmetros como take-profit e stop-loss têm algum impacto nos resultados do backtest. Sinto que esse aspecto precisa de mais otimização. No entanto, a taxa de vitória ainda é boa depois que o sinal da estratégia aciona a transação.
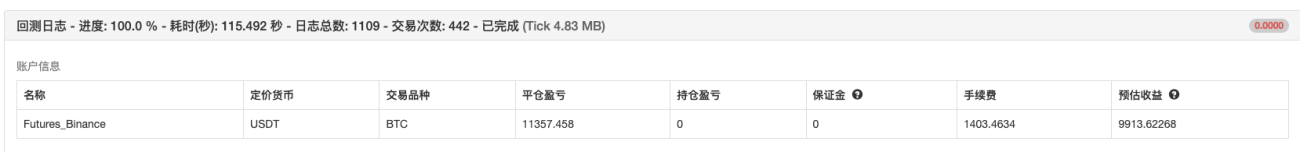
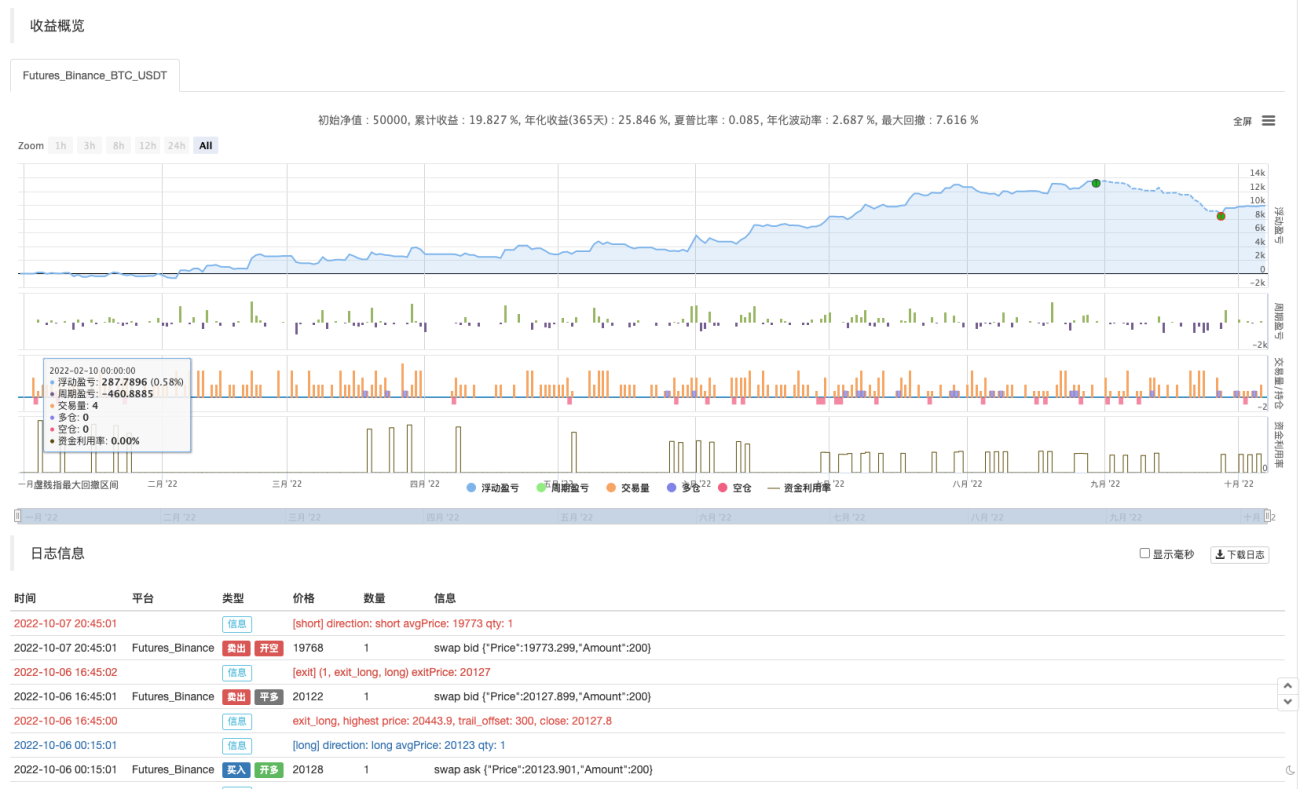
Vamos tentar um contrato perpétuo BTC_USDT:
Os resultados do backtest no BTC também são explosivos:
Endereço estratégico: https://www.fmz.com/strategy/385745
Parece que esse método de negociação é relativamente confiável para compreender a tendência, e o design pode ser ainda mais otimizado com base nessa ideia. Neste artigo, não apenas aprendemos a ideia de uma estratégia de média móvel dupla, mas também aprendemos como processar e aprender as estratégias dos mestres do YouTube. OK, os códigos de estratégia acima são apenas minhas sugestões. Os resultados do backtest não representam os resultados reais específicos. Os códigos de estratégia e designs são apenas para referência. Obrigado pelo seu apoio, até a próxima!


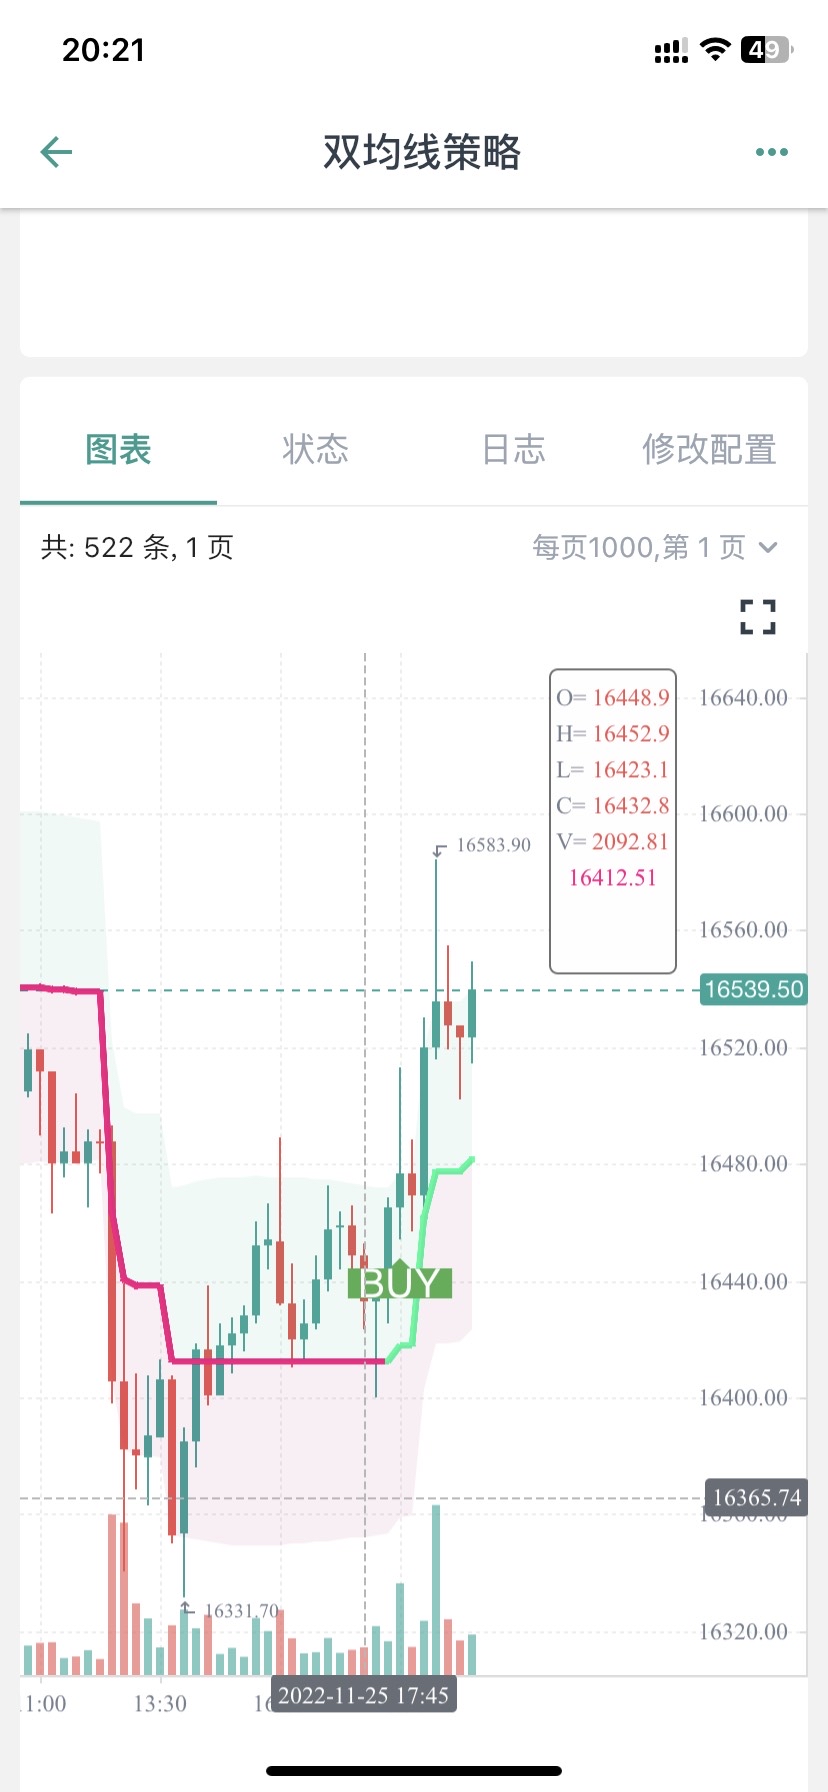


您好,这个是因为图表上显示的BUY标记只是文章中指标的信号显示,后面还结合了均线。
            //Plot Buy and Sell Labels
plotshape(longCondition, title = "Buy Signal", text ="BUY", textcolor = color.white, style=shape.labelup, size = size.normal, location=location.belowbar, color = color.new(color.green, 0))
plotshape(shortCondition, title = "Sell Signal", text ="SELL", textcolor = color.white, style=shape.labeldown, size = size.normal, location=location.abovebar, color = color.new(color.red, 0))
plotshape(longCondition, title = "Buy Signal", text ="BUY 画图显示时,只是longCondition条件符合了。
下单条件在这一块:
            if buyCondition and strategy.position_size == 0
    strategy.entry("long", strategy.long, amount)
    strategy.exit("exit_long", "long", amount, loss=loss, trail_points=trailPoints, trail_offset=trailOffset)
if sellCondition and strategy.position_size == 0
    strategy.entry("short", strategy.short, amount)
    strategy.exit("exit_short", "short", amount, loss=loss, trail_points=trailPoints, trail_offset=trailOffset)

梦大,建议从油管找两三个具有代表性的,改写难度较大,函数、参数、运算方式较多的策略做几个文字版的教程,比如带有类似【line.delete】这样的。(不需要策略盈利,就算是亏损的策略也无所谓,主要是用来学习写策略)。
我现在用这个双均线的策略,已经学会改一些不是非常复杂的组合策略了,改了十几个组合策略,其中有一两个确实是21年22年数据回测结果非常不错的,也已经在跑实盘测试了,但是遇到复杂函数参数运算这种【比如提示:line: 62 Could not find function or function reference 'line.delete',】而在FMZ PINE Script 文档并没有找到line.delete相关解释,用法说明,就懵圈了,所以希望梦大能弄点儿复杂策略改写一下,当然注释也多一些最好。就更方便学习了。[抱拳]
谢谢梦大。


梦大,请教下,PINE可以写复杂点儿的止盈方式吗?比如分层级止盈这样的???谢谢。
如果PINE可以和JS混编就好了,比如用PINE写指标,JS写交易部分就方便多了。。。。。
好的,谢谢梦大,另外请教下,PINE回测时间区间有限制吗?我选择2021年1月1日,到2022年10月11日,提示错误:
RuntimeError: abort(undefined) at Error at jsStackTrace (eval at self.onmessage (https://www.fmz.com/scripts/worker_detours.393054f7.js:1:147), <anonymous>:1:2096171) at stackTrace (eval at self.onmessage (https://www.fmz.com/scripts/worker_detours.393054f7.js:1:147), <anonymous>:1:2096345) at abort (eval at self.onmessage (https://www.fmz.com/scripts/worker_detours.393054f7.js:1:147), <anonymous>:1:2092408) at _abort (eval at self.onmessage (https://www.fmz.com/scripts/worker_detours.393054f7.js:1:147), <anonymous>:1:2137287) at <anonymous>:wasm-function[1297]:0x76bdc at <anonymous>:wasm-function[466]:0x3d789 at <anonymous>:wasm-function[477]:0x42e6b at <anonymous>:wasm-function[471]:0x4149e at <anonymous>:wasm-function[453]:0x3bf18 at <anonymous>:wasm-function[173]:0x13122
但是如果不改时间段就正常回测了。。。。 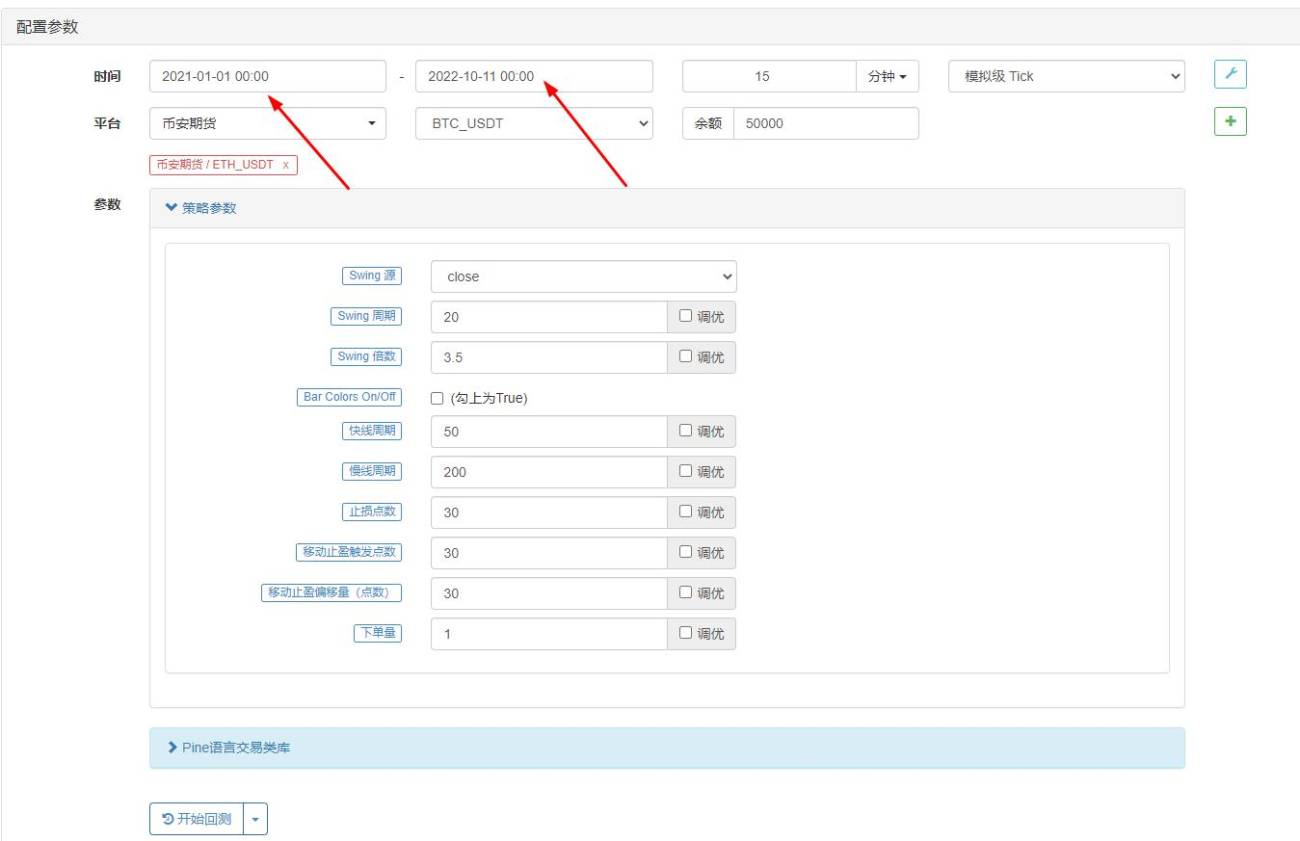

- 1