
Esta estratégia é baseada em uma combinação de tendência e de ruptura de duas formas de negociação, com base no julgamento de tendências de longa linha, para encontrar breakouts de curto período para fazer entradas, para realizar uma negociação de tendência em uma situação de tendência. Além disso, a estratégia também define o nível de stop loss e stop loss para controlar o risco-receita de cada negociação.
Parâmetros de configuração do indicador de vazamento do canal de Deng Dongqian, ciclo padrão 20;
Configure a linha média móvel suave do EMA, com um ciclo por defeito de 200;
A taxa de risco-recompensa é 1,5;
Configuração de parâmetros de retorno de ruptura para multi-cabeças e cabeças vazias, respectivamente;
O que é um “pico” ou um “pico baixo” de uma ruptura registrada?
Multi-Head: se a anterior brecha for baixa e o preço estiver acima da linha superior de Dongguan e acima da linha média do EMA, gerar um sinal multi-head;
Sinal de cabeça-vazia: se a ruptura anterior for alta e o preço estiver abaixo da linha de descida de Dongguan e abaixo da linha média do EMA, gerar um sinal de cabeça-vazia;
Depois de entrar em uma posição multi-cabeça, a parada de perda é definida como um retorno de 5 pontos para baixo do carril de Dongjian, e o stop loss é a relação de risco-ganho multiplicada pela distância de parada;
Depois de entrar em uma posição de cabeça vazia, a parada de perda é definida como um retorno de 5 pontos na linha superior de Dongjian, e a parada é definida como a relação de risco-ganho multiplicada pela distância de parada.
Desta forma, a estratégia combina o discernimento da tendência e a operação de ruptura para capturar oportunidades de períodos mais curtos em tendências de linha longa. Ao mesmo tempo, a configuração de stop loss pode controlar o risco de ganhos de uma única transação.
Seguir as tendências de longo prazo, e evitar a negociação de contrapartida.
O canal de Dongjian é usado como um indicador de linha longa, combinado com o filtro de linha uniforme do EMA, para melhor determinar a direção da tendência.
O mecanismo de prevenção de danos controla cada risco e limita os possíveis danos.
Otimizar a relação risco/benefício, aumentar a relação prejuízo/desavanço e buscar lucros extras.
A configuração dos parâmetros de detecção é flexível, permitindo ajustar a melhor combinação de parâmetros para diferentes mercados.
O canal de Dongxian e a linha de equilíbrio do EMA são indicadores de filtragem e podem emitir sinais errados.
Os “breakthroughs” são facilmente manipulados, e precisam ser identificados para esclarecer o contexto das tendências.
A distância de parada de perda é fixa e não pode ser ajustada com base na volatilidade do mercado.
Parameters O espaço de otimização é limitado e os efeitos no disco rígido são difíceis de garantir.
Os sistemas de negociação não podem suportar a provação de eventos aleatórios, e os eventos de Black Swan podem causar grandes perdas.
Pode-se considerar a adição de mais indicadores para filtragem, como o indicador de vibração, para melhorar a qualidade do sinal.
Pode-se configurar um stop loss inteligente para ajustar a posição de perda de acordo com a volatilidade do mercado e a dinâmica do indicador ATR.
Pode-se testar e otimizar os parâmetros usando métodos como aprendizado de máquina, para torná-los mais próximos do mercado real.
Pode-se otimizar a lógica de entrada, configurando o indicador de VOLUME ou de taxa de flutuação como condição auxiliar para evitar armadilhas.
Pode-se considerar a combinação com estratégias de acompanhamento de tendências ou aprendizagem de máquina para formar estratégias híbridas e aumentar a estabilidade.
Esta estratégia é uma estratégia de ruptura de tipo de rastreamento, a ideia central é julgar a tendência da linha longa, para a operação de ruptura como sinal de tendência, e definir um stop loss para controlar o risco de uma única transação. Esta estratégia tem certas vantagens, mas também há algum espaço para otimização.
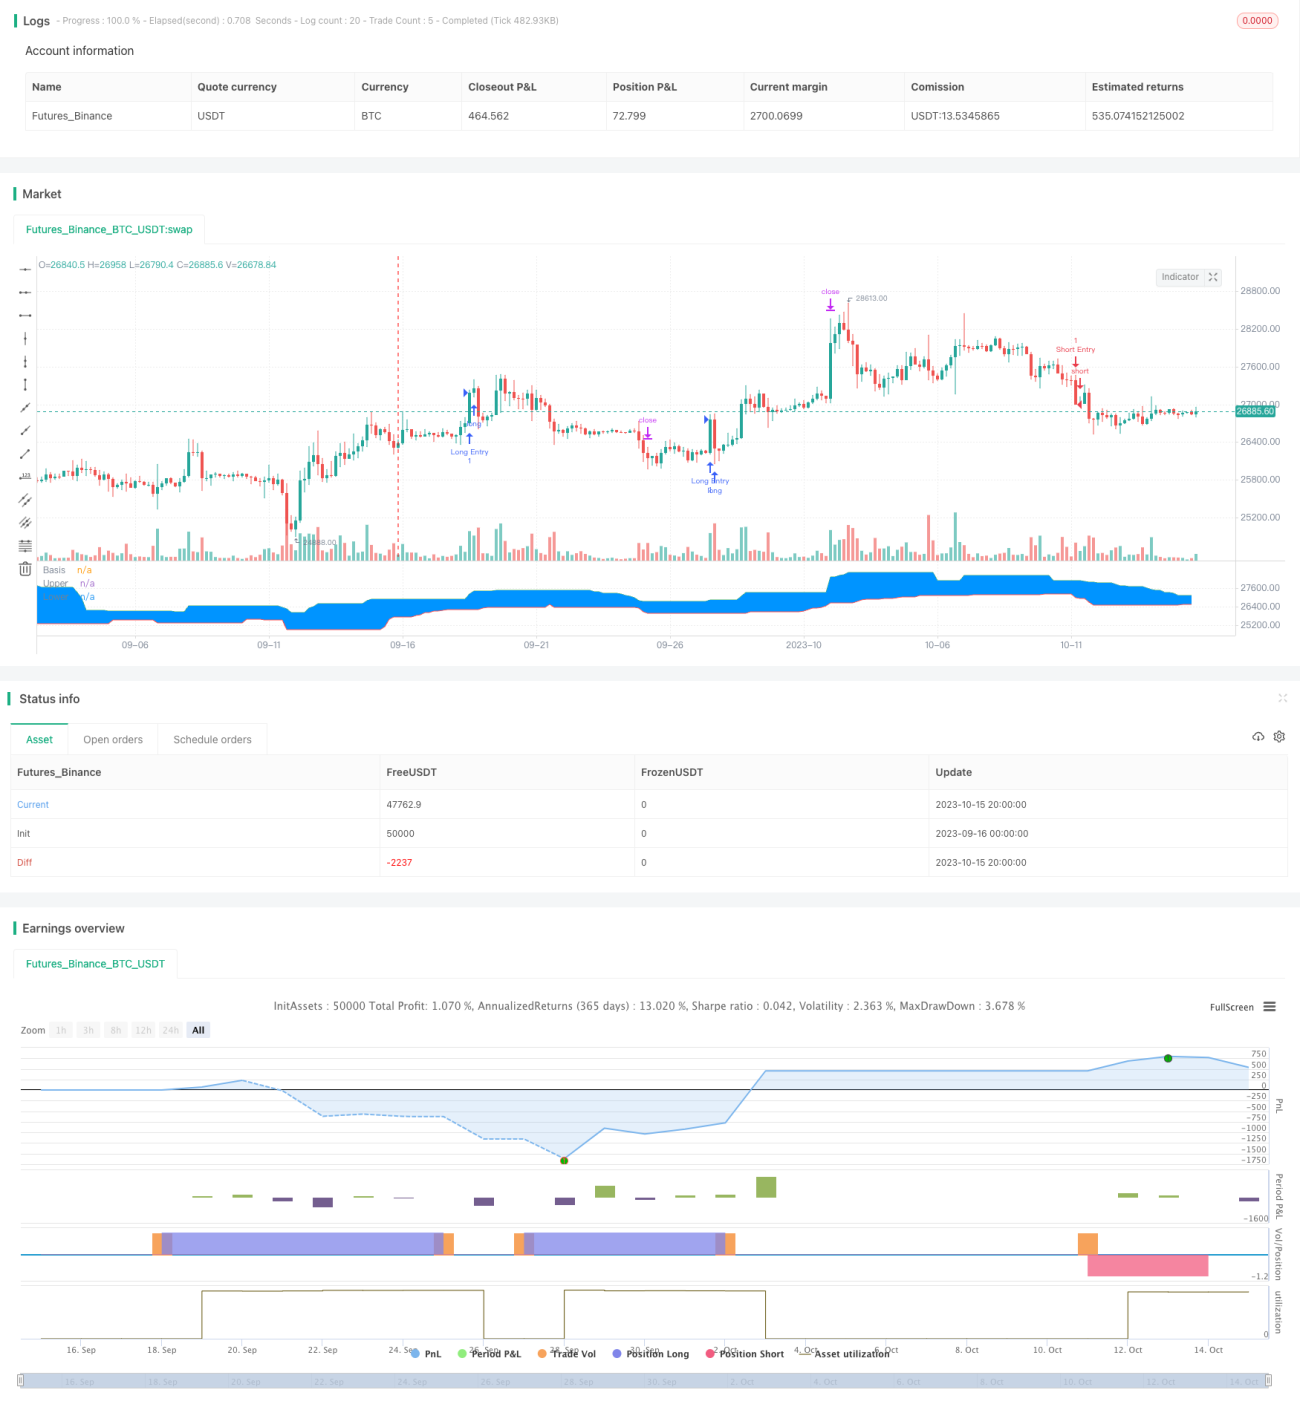
/*backtest
start: 2023-09-16 00:00:00
end: 2023-10-16 00:00:00
period: 4h
basePeriod: 15m
exchanges: [{"eid":"Futures_Binance","currency":"BTC_USDT"}]
*/
//@version=4
// Welcome to my second script on Tradingview with Pinescript
// First of, I'm sorry for the amount of comments on this script, this script was a challenge for me, fun one for sure, but I wanted to thoroughly go through every step before making the script public
// Glad I did so because I fixed some weird things and I ended up forgetting to add the EMA into the equation so our entry signals were a mess
// This one was a lot tougher to complete compared to my MACD crossover trend strategy but I learned a ton from it, which is always good and fun
// Also I'll explain the strategy and how I got there through some creative coding(I'm saying creative because I had to figure this stuff out by myself as I couldn't find any reference codes)
// First things first. This is a Donchian Channel Breakout strategy which follows the following rules
// If the price hits the upperband of the Donchian Channel + price is above EMA and the price previously hit the lowerband of the Donchian Channel it's a buy signal
// If the price hits the lowerband of the Donchian Channel + price is below EMA and the price prevbiously hit the upper band of the Donchian Channel it's a sell signal
// Stop losses are set at the lower or upper band with a 0.5% deviation because we are acting as if those two bands are the resistance in this case
// Last but not least(yes, this gave BY FAR the most trouble to code), the profit target is set with a 1.5 risk to reward ratio
// If you have any suggestions to make my code more efficient, I'll be happy to hear so from you
// So without further ado, let's walk through the code
// The first line is basically standard because it makes backtesting so much more easy, commission value is based on Binance futures fees when you're using BNB to pay those fees in the futures market
// strategy(title="Donchian Channels", shorttitle="DC", overlay=true, default_qty_type = strategy.cash, default_qty_value = 150, initial_capital = 1000, currency = currency.USD, commission_type = "percent", commission_value = 0.036)
// The built-in Donchian Channels + an added EMA input which I grouped with the historical bars from the Donchian Channels
length = input(20, minval=1, group = "Indicators")
lower = lowest(length)
upper = highest(length)
basis = avg(upper, lower)
emaInput = input(title = "EMA Input", type = input.integer, defval = 200, minval = 10, maxval = 400, step = 1, group = "Indicators")
// I've made three new inputs, for risk/reward ratio and for the standard pullback deviation. My advise is to not use the pullback inputs as I'm not 100% sure if they work as intended or not
riskreward = input(title = "Risk/Reward Ratio", type = input.float, defval = 1.50, minval = 0.01, maxval = 100, step = 0.01, group = "Risk/Reward")
pullbackLong = input(title = "Distance from Long pullback %", type = input.float, defval = 0.995, minval = 0.001, maxval = 2, step = 0.001, group = "Risk/Reward")
pullbackShort = input(title = "Distance from Short pullback %", type = input.float, defval = 1.005, minval = 0.001, maxval = 2, step = 0.001, group = "Risk/Reward")
// Input backtest range, you can adjust these in the input options, just standard stuff
fromMonth = input(defval = 1, title = "From Month", type = input.integer, minval = 1, maxval = 12, group = "Backtest Date Range")
fromDay = input(defval = 1, title = "From Day", type = input.integer, minval = 1, maxval = 31, group = "Backtest Date Range")
fromYear = input(defval = 2000, title = "From Year", type = input.integer, minval = 1970, group = "Backtest Date Range")
thruMonth = input(defval = 1, title = "Thru Month", type = input.integer, minval = 1, maxval = 12, group = "Backtest Date Range")
thruDay = input(defval = 1, title = "Thru Day", type = input.integer, minval = 1, maxval = 31, group = "Backtest Date Range")
thruYear = input(defval = 2099, title = "Thru Year", type = input.integer, minval = 1970, group = "Backtest Date Range")
// Date variable also standard stuff
inDataRange = (time >= timestamp(syminfo.timezone, fromYear, fromMonth, fromDay, 0, 0)) and (time < timestamp(syminfo.timezone, thruYear, thruMonth, thruDay, 0, 0))
// I had to makes these variables because the system has to remember whether the previous 'breakout' was a high or a low
// Also, because I based my stoploss on the upper/lower band of the indicator I had to find a way to change this value just once without losing the value, that was added, on the next bar
var previousishigh = false
var previousislow = false
var longprofit = 0.0
var shortprofit = 0.0
var stoplossLong = 0.0
var stoplossShort = 0.0
// These are used as our entry variables
emaCheck = ema(close, emaInput)
longcond = high >= upper and close > emaCheck
shortcond = low <= lower and close < emaCheck
// With these two if statements I'm changing the boolean variable above to true, we need this to decide out entry position
if high >= upper
previousishigh := true
if low <= lower
previousislow := true
// Made a last minute change on this part. To clean up our entry signals we don't want our breakouts, while IN a position, to change. This way we do not instantly open a new position, almost always in the opposite direction, upon exiting one
if strategy.position_size > 0 or strategy.position_size < 0
previousishigh := false
previousislow := false
// Strategy inputs
// Long - previous 'breakout' has to be a low, the current price has to be a new high and above the EMA, we're not allowed to be in a position and ofcourse it has to be within our given data for backtesting purposes
if previousislow == true and longcond and strategy.position_size == 0 and inDataRange
strategy.entry("Long Entry", strategy.long, comment = "Entry Long")
stoplossLong := lower * pullbackLong
longprofit := ((((1 - stoplossLong / close) * riskreward) + 1) * close)
strategy.exit("Long Exit", "Long Entry", limit = longprofit, stop = stoplossLong, comment = "Long Exit")
// Short - Previous 'breakout' has to be a high, current price has to be a new low and lowe than the 200EMA, we're not allowed to trade when we're in a position and it has to be within our given data for backtesting purposes
if previousishigh == true and shortcond and strategy.position_size == 0 and inDataRange
strategy.entry("Short Entry", strategy.short, comment = "Entry Short")
stoplossShort := upper * pullbackShort
shortprofit := (close - ((((1 - close / stoplossShort) * riskreward) * close)))
strategy.exit("Short Exit", "Short Entry", limit = shortprofit, stop = stoplossShort, comment = "Short Exit")
// This plots the Donchian Channels on the chart which is just using the built-in Donchian Channels
plot(basis, "Basis", color=color.blue)
u = plot(upper, "Upper", color=color.green)
l = plot(lower, "Lower", color=color.red)
fill(u, l, color=#0094FF, transp=95, title="Background")
// These plots are to show if the variables are working as intended, it's a mess I know but I didn't have any better ideas, they work well enough for me
// plot(previousislow ? close * 0.95 : na, color=color.red, linewidth=2, style=plot.style_linebr)
// plot(previousishigh ? close * 1.05 : na, color=color.green, style=plot.style_linebr)
// plot(longprofit, color=color.purple)
// plot(shortprofit, color=color.silver)
// plot(stoplossLong)
// plot(stoplossShort)
// plot(strategy.position_size)