
A estratégia de negociação de tremor de modelo triplo é uma estratégia de negociação de linha curta baseada em uma combinação de vários indicadores tecnológicos. A estratégia combina indicadores de tendência super, linha média de SSL híbrida e indicadores QQE aprimorados para formar um sinal de negociação estável. É aplicável a variedades de negociação com alta volatilidade, como moedas digitais e ações, especialmente com bom desempenho após o período de ruptura.
A entrada de Long Posh:
A entrada em estoque:
A tendência de alta é a de que o mercado de ações esteja em alta.
A saída do estoque vazio: a super tendência é dominada pelo vazio
Opção de Stop Percentage, Stop ATR ou Stop no preço mais baixo ou mais alto
A taxa de retorno do stop-loss pode ser configurada para calcular automaticamente o preço do stop-loss
Opção de usar a lógica de gestão de fundos para controlar o tamanho da posição
A combinação de super tendências, a linha média mista de SSL e o indicador de versão melhorada de QQE, os diferentes indicadores são mutuamente verificados e podem filtrar brechas falsas, formando um sinal de negociação de alta qualidade.
A estratégia usa o método de negociação de linhas curtas, focada em capturar oscilações de preços de linhas curtas. A supertrend permite rastrear efetivamente as tendências de preços, enquanto a linha de média mista SSL permite identificar claramente os níveis de pressão de suporte, e ambos podem ser usados para obter ganhos em situações de turbulência.
O Stop Loss pode escolher a porcentagem, o valor do ATR ou o máximo recente. O Stop Stop pode definir a taxa de retorno. A gestão de fundos pode controlar a posição. O usuário pode escolher uma combinação livre de acordo com as características da variedade e as preferências de risco.
O gráfico de estratégia é claro e visível, mostrando os níveis de stop loss e stop loss. Os sinais de linha de abertura são fáceis de identificar.
Como as negociações de linha curta, não é possível evitar completamente os pequenos prejuízos do tipo de choque comum. A largura de parada pode ser relaxada adequadamente, otimizando a lógica de gerenciamento de fundos.
Quando ocorrem falsas rupturas, pode-se formar um sinal de erro. Pode-se testar EMAs de diferentes períodos para filtrar falsas rupturas ou otimizar parâmetros de indicadores de identificação de tendências.
Se os indicadores básicos falharem, haverá múltiplos sinais de erro. Verifique periodicamente a eficácia dos indicadores e corrija os problemas em tempo hábil.
O ciclo de retrospecção atual é um período de tempo fixo e não pode corresponder a diferentes ciclos de mercado da variedade. Recomenda-se a otimização para corresponder ao período de tempo de negociação do contratante.
Pode-se ajustar os parâmetros da estratégia para diferentes variedades de dados, aumentando a taxa de vitória das posições longas e curtas. Recomenda-se o uso de métodos de otimização progressiva para comparar o impacto dos diferentes parâmetros na estratégia.
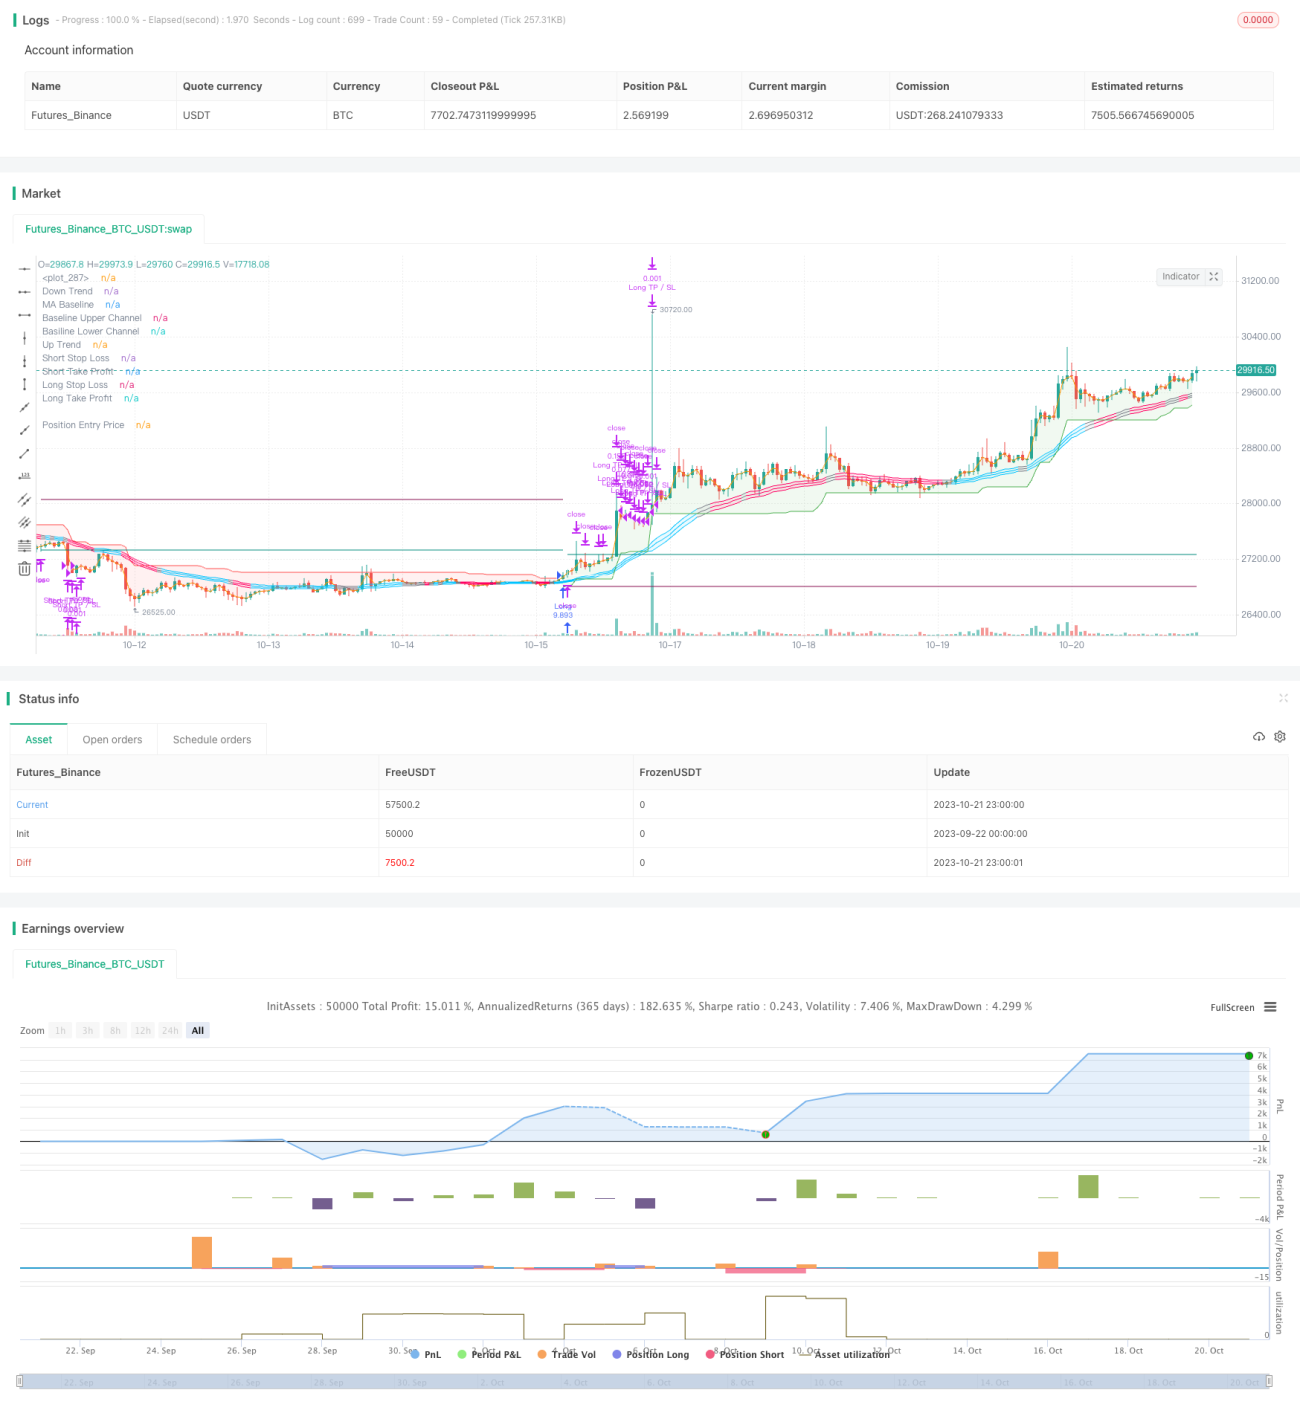
A estratégia utiliza vários indicadores em combinação para formar sinais de negociação, filtrando efetivamente as brechas falsas, e é adequada para moedas digitais e ações individuais com maior volatilidade. Ao mesmo tempo, oferece várias opções de stop loss e stop loss, com flexibilidade de uso. De um modo geral, a estratégia forma um sinal de negociação estável e pode obter melhores ganhos em situações de oscilação de linha curta e média.
/*backtest
start: 2023-09-22 00:00:00
end: 2023-10-22 00:00:00
period: 1h
basePeriod: 15m
exchanges: [{"eid":"Futures_Binance","currency":"BTC_USDT"}]
*/
// This source code is subject to the terms of the Mozilla Public License 2.0 at https://mozilla.org/MPL/2.0/
// © fpemehd
// Thanks to myncrypto, jason5480, kevinmck100
// @version=5
strategy(title = '[D] SuperTrend + SSL Hybrid + QQE MOD',
shorttitle = '[D] SSQ Strategy',
overlay = true,
pyramiding = 0,
currency = currency.USD,
default_qty_type = strategy.percent_of_equity,
default_qty_value = 100,
commission_value = 0.1,
initial_capital = 100000,
max_bars_back = 500,
max_lines_count = 150,
max_labels_count = 300)
// ░░░░░░░░░░░░░░░░░░░░░░░░░░░░░░░░░░░░░░░░░░░░░░░░░░░░░░░░░░░░░░░░░░░░░░░░░░░░░░░░░░░░░░░░░░░░░░░░░░░░░░░░░░░░░░░░░░░░░░░░░░░░░░░░░░░░░░░░░░░░░░░░░░
// Time, Direction, Etc - Basic Settings Inputs
// ░░░░░░░░░░░░░░░░░░░░░░░░░░░░░░░░░░░░░░░░░░░░░░░░░░░░░░░░░░░░░░░░░░░░░░░░░░░░░░░░░░░░░░░░░░░░░░░░░░░░░░░░░░░░░░░░░░░░░░░░░░░░░░░░░░░░░░░░░░░░░░░░░░
// 1. Time: Based on UTC +09:00
i_start = input (defval = timestamp("20 Jan 1990 00:00 +0900"), title = "Start Date", tooltip = "Choose Backtest Start Date", inline = "Start Date", group = "Time" )
i_end = input (defval = timestamp("20 Dec 2030 00:00 +0900"), title = "End Date", tooltip = "Choose Backtest End Date", inline = "End Date", group = "Time" )
inTime = true
// 2. Inputs for direction: Long? Short? Both?
i_longEnabled = input.bool (defval = true , title = "Long?", tooltip = "Enable Long Position Trade?", inline = "Long / Short", group = "Long / Short" )
i_shortEnabled = input.bool (defval = true , title = "Short?", tooltip = "Enable Short Position Trade?", inline = "Long / Short", group = "Long / Short" )
// ░░░░░░░░░░░░░░░░░░░░░░░░░░░░░░░░░░░░░░░░░░░░░░░░░░░░░░░░░░░░░░░░░░░░░░░░░░░░░░░░░░░░░░░░░░░░░░░░░░░░░░░░░░░░░░░░░░░░░░░░░░░░░░░░░░░░░░░░░░░░░░░░░░
// Filter - Inputs, Indicaotrs
// ░░░░░░░░░░░░░░░░░░░░░░░░░░░░░░░░░░░░░░░░░░░░░░░░░░░░░░░░░░░░░░░░░░░░░░░░░░░░░░░░░░░░░░░░░░░░░░░░░░░░░░░░░░░░░░░░░░░░░░░░░░░░░░░░░░░░░░░░░░░░░░░░░░
// 3. Use Filters? What Filters?
//// 3-1. ATR Filter
i_ATRFilterOn = input.bool (defval = false , title = "ATR Filter On?", tooltip = "ATR Filter On? Order will not be made unless filter condition is fulfilled", inline = "1", group = "Filters")
i_ATRFilterLen = input.int (defval = 14, title = "Length for ATR Filter", minval = 1 , maxval = 100 , step = 1 , tooltip = "", inline = "2", group = "Filters")
i_ATRSMALen = input.int (defval = 40, title = "SMA Length for ATR SMA", minval = 1 , maxval = 100000 , step = 1 , tooltip = "ATR should be bigger than this", inline = "2", group = "Filters")
bool ATRFilter = ta.atr(i_ATRFilterLen) >= ta.sma(ta.atr(length = i_ATRFilterLen), i_ATRSMALen) ? true : false
//// 3-2. EMA Filter
i_EMAFilterOn = input.bool (defval = false , title = "EMA Filter On?", tooltip = "EMA Filter On? Order will not be made unless filter condition is fulfilled", inline = "3", group = "Filters")
i_EMALen = input.int (defval = 200, title = "EMA Length", minval = 1 , maxval = 100000 , step = 1 , tooltip = "EMA Length", inline = "4", group = "Filters")
bool longEMAFilter = close >= ta.ema(source = close, length = i_EMALen) ? true : false
bool shortEMAFilter = close <= ta.ema(source = close, length = i_EMALen) ? true : false
plot(i_EMAFilterOn ? ta.ema(source = close, length = i_EMALen) : na, title = "EMA Filter", color = color.new(color = color.orange , transp = 0), linewidth = 1)
//// 3-3. ADX Filter
////3-4. DMI Filter (Uses same ADX Length)
i_ADXFilterOn = input.bool (defval = false , title = "ADX Filter On?", tooltip = "ADX Filter On? Order will not be made unless filter condition is fulfilled", inline = "5", group = "Filters")
i_DMIFilterOn = input.bool (defval = false , title = "DMI Filter On?", tooltip = "DMI (Directional Moving Index) Filter On? Order will not be made unless filter condition is fulfilled", inline = "6", group = "Filters")
i_ADXLength = input.int (defval = 20, title = "ADX Length", minval = 1 , maxval = 100000 , step = 1 , tooltip = "ADX Length", inline = "7", group = "Filters")
i_ADXThreshold = input.int (defval = 25, title = "ADX Threshold", minval = 1 , maxval = 100000 , step = 1 , tooltip = "ADX should be bigger than threshold", inline = "8", group = "Filters")
//// 3-4. SuperTrend Filter
// i_superTrendFilterOn = input.bool (defval = false , title = "Super Trend Filter On?", tooltip = "Super Trend Filter On? Order will not be made unless filter condition is fulfilled", inline = "9", group = "Filters")
// i_superTrendATRLen = input.int (defval = 10, title = "ATR Length", minval = 1 , maxval = 100000 , step = 1 , tooltip = "Super Trend ATR Length", inline = "10", group = "Filters")
// i_superTrendATRFactor = input.float (defval = 3, title = "Factor", minval = 1 , maxval = 100000 , step = 0.1 , tooltip = "Super Trend ATR Factor", inline = "11", group = "Filters")
// ADX and DI Thanks to @BeikabuOyaji
int len = i_ADXLength
float th = i_ADXThreshold
TR = math.max(math.max(high - low, math.abs(high - nz(close[1]))), math.abs(low - nz(close[1])))
DMPlus = high - nz(high[1]) > nz(low[1]) - low ? math.max(high - nz(high[1]), 0) : 0
DMMinus = nz(low[1]) - low > high - nz(high[1]) ? math.max(nz(low[1]) - low, 0) : 0
SmoothedTR = 0.0
SmoothedTR := nz(SmoothedTR[1]) - nz(SmoothedTR[1]) / len + TR
SmoothedDMPlus = 0.0
SmoothedDMPlus := nz(SmoothedDMPlus[1]) - nz(SmoothedDMPlus[1]) / len + DMPlus
SmoothedDMMinus = 0.0
SmoothedDMMinus := nz(SmoothedDMMinus[1]) - nz(SmoothedDMMinus[1]) / len + DMMinus
DIPlus = SmoothedDMPlus / SmoothedTR * 100
DIMinus = SmoothedDMMinus / SmoothedTR * 100
DX = math.abs(DIPlus - DIMinus) / (DIPlus + DIMinus) * 100
ADX = ta.sma(source = DX, length = len)
// plot(DIPlus, color=color.new(color.green, 0), title='DI+')
// plot(DIMinus, color=color.new(color.red, 0), title='DI-')
// plot(ADX, color=color.new(color.navy, 0), title='ADX')
// hline(th, color=color.white)
bool ADXFilter = ADX > th ? true : false
bool longDMIFilter = DIPlus >= DIMinus ? true : false
bool shortDMIFilter = DIPlus <= DIMinus ? true : false
// Calculate Super Trend for Filter
// i_superTrendFilterOn = input.bool (defval = false , title = "Super Trend Filter On?", tooltip = "Super Trend Filter On? Order will not be made unless filter condition is fulfilled", inline = "9", group = "Filters")
// i_superTrendATRLen = input.int (defval = 10, title = "ATR Length", minval = 1 , maxval = 100000 , step = 1 , tooltip = "Super Trend ATR Length", inline = "10", group = "Filters")
// i_superTrendATRFactor = input.float (defval = 3, title = "Factor", minval = 1 , maxval = 100000 , step = 0.1 , tooltip = "Super Trend ATR Factor", inline = "11", group = "Filters")
// [supertrend, direction] = ta.supertrend(factor = i_superTrendATRFactor, atrPeriod = i_superTrendATRLen)
// bodyMiddle = plot((open + close) / 2, display=display.none)
// upTrend = plot(i_superTrendFilterOn ? direction < 0 ? supertrend : na : na, "Up Trend", color = color.green, style=plot.style_linebr)
// downTrend = plot(i_superTrendFilterOn ? direction < 0 ? na : supertrend : na, "Down Trend", color = color.red, style=plot.style_linebr)
// fill(bodyMiddle, upTrend, color.new(color.green, 90), fillgaps=false)
// fill(bodyMiddle, downTrend, color.new(color.red, 90), fillgaps=false)
// bool longSTFilter = direction <= 0
// bool shortSTFilter = direction >= 0
// Filter
bool longFilterFilled = (not i_ATRFilterOn or ATRFilter) and (not i_EMAFilterOn or longEMAFilter) and (not i_ADXFilterOn or ADXFilter) and (not i_DMIFilterOn or longDMIFilter) // and (not i_superTrendFilterOn or longSTFilter)
bool shortFilterFilled = (not i_ATRFilterOn or ATRFilter) and (not i_EMAFilterOn or shortEMAFilter) and (not i_ADXFilterOn or ADXFilter) and (not i_DMIFilterOn or shortDMIFilter) // and (not i_superTrendFilterOn or shortSTFilter)
// ░░░░░░░░░░░░░░░░░░░░░░░░░░░░░░░░░░░░░░░░░░░░░░░░░░░░░░░░░░░░░░░░░░░░░░░░░░░░░░░░░░░░░░░░░░░░░░░░░░░░░░░░░░░░░░░░░░░░░░░░░░░░░░░░░░░░░░░░░░░░░░░░░░
// Strategy Logic (Entry & Exit Condition) - Inputs, Indicators for Strategy
// ░░░░░░░░░░░░░░░░░░░░░░░░░░░░░░░░░░░░░░░░░░░░░░░░░░░░░░░░░░░░░░░░░░░░░░░░░░░░░░░░░░░░░░░░░░░░░░░░░░░░░░░░░░░░░░░░░░░░░░░░░░░░░░░░░░░░░░░░░░░░░░░░░░
//// Indicators
// Inputs for Strategy Indicators
//// 1. Super Trend
i_superTrendATRLen = input.int (defval = 10, title = "ATR Length", minval = 1 , maxval = 100000 , step = 1 , tooltip = "Super Trend ATR Length", inline = "1", group = "1: SuperTrend")
i_superTrendATRFactor = input.float (defval = 3, title = "Factor", minval = 1 , maxval = 100000 , step = 0.1 , tooltip = "Super Trend ATR Factor", inline = "2", group = "1: SuperTrend")
[supertrend, direction] = ta.supertrend(factor = i_superTrendATRFactor, atrPeriod = i_superTrendATRLen)
//// 2. SSL Hybrid Baseline
i_useTrueRange = input.bool (defval = true, title = "use true range for Keltner Channel?", tooltip = "", inline = "1", group = "2: SSL Hybrid")
i_maType = input.string (defval ='EMA', title='Baseline Type', options=['SMA', 'EMA', 'DEMA', 'TEMA', 'LSMA', 'WMA', 'VAMA', 'TMA', 'HMA', 'McGinley'], inline="2", group = "2: SSL Hybrid")
i_len = input.int (defval =30, title='Baseline Length', inline="2", group = "2: SSL Hybrid")
i_multy = input.float (defval = 0.2, title='Base Channel Multiplier', minval = 0, maxval = 100, step=0.05, inline="3", group = "2: SSL Hybrid")
i_volatility_lookback = input.int (defval =10, title='Volatility lookback length(for VAMA)', inline='4',group="2: SSL Hybrid")
tema(src, len) =>
ema1 = ta.ema(src, len)
ema2 = ta.ema(ema1, len)
ema3 = ta.ema(ema2, len)
3 * ema1 - 3 * ema2 + ema3
f_ma(type, src, len) =>
float result = 0
if type == 'TMA'
result := ta.sma(ta.sma(src, math.ceil(len / 2)), math.floor(len / 2) + 1)
result
if type == 'LSMA'
result := ta.linreg(src, len, 0)
result
if type == 'SMA' // Simple
result := ta.sma(src, len)
result
if type == 'EMA' // Exponential
result := ta.ema(src, len)
result
if type == 'DEMA' // Double Exponential
e = ta.ema(src, len)
result := 2 * e - ta.ema(e, len)
result
if type == 'TEMA' // Triple Exponential
e = ta.ema(src, len)
result := 3 * (e - ta.ema(e, len)) + ta.ema(ta.ema(e, len), len)
result
if type == 'WMA' // Weighted
result := ta.wma(src, len)
result
if type == 'VAMA' // Volatility Adjusted
/// Copyright © 2019 to present, Joris Duyck (JD)
mid = ta.ema(src, len)
dev = src - mid
vol_up = ta.highest(dev, i_volatility_lookback)
vol_down = ta.lowest(dev, i_volatility_lookback)
result := mid + math.avg(vol_up, vol_down)
result
if type == 'HMA' // Hull
result := ta.wma(2 * ta.wma(src, len / 2) - ta.wma(src, len), math.round(math.sqrt(len)))
result
if type == 'McGinley'
mg = 0.0
mg := na(mg[1]) ? ta.ema(src, len) : mg[1] + (src - mg[1]) / (len * math.pow(src / mg[1], 4))
result := mg
result
result
//// 2-1. SSL Hybrid Keltner Baseline Channel
BBMC = f_ma (i_maType, close, i_len) // BaseLone
Keltma = f_ma (i_maType, close, i_len)
range_1 = i_useTrueRange ? ta.tr : high - low
rangema = ta.ema(range_1, i_len)
upperk = Keltma + rangema * i_multy
lowerk = Keltma - rangema * i_multy
//// 3. QQE MOD, thanks to Mihkel100
RSI_Period = input.int (defval = 6, title = 'RSI Length', inline = "1", group = "3: QQE MOD")
SF = input.int (defval = 5, title = 'RSI Smoothing', inline = "2", group = "3: QQE MOD")
QQE = input.float (defval = 3, title = 'Fast QQE Factor', inline = "3", group = "3: QQE MOD")
ThreshHold = input.int (defval = 3, title = 'Thresh-hold', inline = "4", group = "3: QQE MOD")
src = input (defval = close, title='RSI Source')
Wilders_Period = RSI_Period * 2 - 1
Rsi = ta.rsi(src, RSI_Period)
RsiMa = ta.ema(Rsi, SF)
AtrRsi = math.abs(RsiMa[1] - RsiMa)
MaAtrRsi = ta.ema(AtrRsi, Wilders_Period)
dar = ta.ema(MaAtrRsi, Wilders_Period) * QQE
longband = 0.0
shortband = 0.0
trend = 0
DeltaFastAtrRsi = dar
RSIndex = RsiMa
newshortband = RSIndex + DeltaFastAtrRsi
newlongband = RSIndex - DeltaFastAtrRsi
longband := RSIndex[1] > longband[1] and RSIndex > longband[1] ? math.max(longband[1], newlongband) : newlongband
shortband := RSIndex[1] < shortband[1] and RSIndex < shortband[1] ? math.min(shortband[1], newshortband) : newshortband
cross_1 = ta.cross(longband[1], RSIndex)
trend := ta.cross(RSIndex, shortband[1]) ? 1 : cross_1 ? -1 : nz(trend[1], 1)
FastAtrRsiTL = trend == 1 ? longband : shortband
////////////////////
length = input.int (defval = 50, minval = 1, title = 'Bollinger Length', group = "3: QQE MOD")
mult = input.float (defval = 0.35, minval = 0.01, maxval = 5, step = 0.1, title = 'BB Multiplier', group = "3: QQE MOD")
basis = ta.sma(FastAtrRsiTL - 50, length)
dev = mult * ta.stdev(FastAtrRsiTL - 50, length)
upper = basis + dev
lower = basis - dev
color_bar = RsiMa - 50 > upper ? #00c3ff : RsiMa - 50 < lower ? #ff0062 : color.gray
//
// Zero cross
QQEzlong = 0
QQEzlong := nz(QQEzlong[1])
QQEzshort = 0
QQEzshort := nz(QQEzshort[1])
QQEzlong := RSIndex >= 50 ? QQEzlong + 1 : 0
QQEzshort := RSIndex < 50 ? QQEzshort + 1 : 0
//
// Zero = hline(0, color=color.white, linestyle=hline.style_dotted, linewidth=1)
////////////////////////////////////////////////////////////////
RSI_Period2 = input.int (defval = 6, title = 'RSI 2 Length', group = "3: QQE MOD")
SF2 = input.int (defval = 5, title = 'RSI Smoothing', group = "3: QQE MOD")
QQE2 = input.float (defval = 1.61, title = 'Fast QQE2 Factor', group = "3: QQE MOD")
ThreshHold2 = input.int (defval = 3, title = 'Thresh-hold', group = "3: QQE MOD")
src2 = input (defval = close, title = 'RSI Source', group = "3: QQE MOD")
//
//
Wilders_Period2 = RSI_Period2 * 2 - 1
Rsi2 = ta.rsi(src2, RSI_Period2)
RsiMa2 = ta.ema(Rsi2, SF2)
AtrRsi2 = math.abs(RsiMa2[1] - RsiMa2)
MaAtrRsi2 = ta.ema(AtrRsi2, Wilders_Period2)
dar2 = ta.ema(MaAtrRsi2, Wilders_Period2) * QQE2
longband2 = 0.0
shortband2 = 0.0
trend2 = 0
DeltaFastAtrRsi2 = dar2
RSIndex2 = RsiMa2
newshortband2 = RSIndex2 + DeltaFastAtrRsi2
newlongband2 = RSIndex2 - DeltaFastAtrRsi2
longband2 := RSIndex2[1] > longband2[1] and RSIndex2 > longband2[1] ? math.max(longband2[1], newlongband2) : newlongband2
shortband2 := RSIndex2[1] < shortband2[1] and RSIndex2 < shortband2[1] ? math.min(shortband2[1], newshortband2) : newshortband2
cross_2 = ta.cross(longband2[1], RSIndex2)
trend2 := ta.cross(RSIndex2, shortband2[1]) ? 1 : cross_2 ? -1 : nz(trend2[1], 1)
FastAtrRsi2TL = trend2 == 1 ? longband2 : shortband2
//
// Zero cross
QQE2zlong = 0
QQE2zlong := nz(QQE2zlong[1])
QQE2zshort = 0
QQE2zshort := nz(QQE2zshort[1])
QQE2zlong := RSIndex2 >= 50 ? QQE2zlong + 1 : 0
QQE2zshort := RSIndex2 < 50 ? QQE2zshort + 1 : 0
//
hcolor2 = RsiMa2 - 50 > ThreshHold2 ? color.silver : RsiMa2 - 50 < 0 - ThreshHold2 ? color.silver : na
Greenbar1 = RsiMa2 - 50 > ThreshHold2
Greenbar2 = RsiMa - 50 > upper
Redbar1 = RsiMa2 - 50 < 0 - ThreshHold2
Redbar2 = RsiMa - 50 < lower
// Plot: Indicators
//// 1. Super Trend
bodyMiddle = plot((open + close) / 2, display=display.none)
upTrend = plot(direction < 0 ? supertrend : na, "Up Trend", color = color.green, style=plot.style_linebr)
downTrend = plot(direction < 0 ? na : supertrend, "Down Trend", color = color.red, style=plot.style_linebr)
fill(bodyMiddle, upTrend, color.new(color.green, 90), fillgaps=false)
fill(bodyMiddle, downTrend, color.new(color.red, 90), fillgaps=false)
//// 2. SSL Hybrid
var bullSSLColor = #00c3ff
var bearSSLColor = #ff0062
// color_bar = color.new(color = close > upperk ? bullSSLColor : close < lowerk ? bearSSLColor : color.gray, transp = 0)
// i_show_color_bar = input.bool(defval = true , title = "Color Bars")
// barcolor(i_show_color_bar ? color_bar : na)
plot(series = BBMC, title = 'MA Baseline', color = color_bar, linewidth = 1, style = plot.style_line)
up_channel = plot(upperk, color=color_bar, title='Baseline Upper Channel')
low_channel = plot(lowerk, color=color_bar, title='Basiline Lower Channel')
fill(up_channel, low_channel, color.new(color=color_bar, transp=90))
//// 3. QQE MOD: No Plotting because of overlay option
// plot(FastAtrRsi2TL - 50, title='QQE Line', color=color.new(color.white, 0), linewidth=2)
// plot(RsiMa2 - 50, color=hcolor2, title='Histo2', style=plot.style_columns, transp=50)
// plot(Greenbar1 and Greenbar2 == 1 ? RsiMa2 - 50 : na, title='QQE Up', style=plot.style_columns, color=color.new(#00c3ff, 0))
// plot(Redbar1 and Redbar2 == 1 ? RsiMa2 - 50 : na, title='QQE Down', style=plot.style_columns, color=color.new(#ff0062, 0))
////// Entry, Exit
// Long, Short Logic with Indicator
bool longSTCond = direction[1] >= 0 and direction <= 0
bool shortSTCond = direction[1] <= 0 and direction >= 0
bool longSSLCond = close > upperk
bool shortSSLCond = close < lowerk
bool longQQECond = Greenbar1 and Greenbar2 == 1
bool shortQQECond = Redbar1 and Redbar2 == 1
// Basic Cond + Long, Short Entry Condition
bool longCond = (i_longEnabled and inTime) and (longSTCond and longSSLCond and longQQECond)
bool shortCond = (i_shortEnabled and inTime) and (shortSTCond and shortSSLCond and shortQQECond)
// Basic Cond + Long, Short Exit Condition
bool closeLong = (i_longEnabled) and (shortSTCond)
bool closeShort = (i_shortEnabled) and (longSTCond)
// ░░░░░░░░░░░░░░░░░░░░░░░░░░░░░░░░░░░░░░░░░░░░░░░░░░░░░░░░░░░░░░░░░░░░░░░░░░░░░░░░░░░░░░░░░░░░░░░░░░░░░░░░░░░░░░░░░░░░░░░░░░░░░░░░░░░░░░░░░░░░░░░░░░
// Position Control
// ░░░░░░░░░░░░░░░░░░░░░░░░░░░░░░░░░░░░░░░░░░░░░░░░░░░░░░░░░░░░░░░░░░░░░░░░░░░░░░░░░░░░░░░░░░░░░░░░░░░░░░░░░░░░░░░░░░░░░░░░░░░░░░░░░░░░░░░░░░░░░░░░░░
// Long, Short Entry Condition + Not entered Position Yet
bool openLong = longCond and not (strategy.opentrades.size(strategy.opentrades - 1) > 0) and longFilterFilled
bool openShort = shortCond and not (strategy.opentrades.size(strategy.opentrades - 1) < 0) and shortFilterFilled
bool enteringTrade = openLong or openShort
float entryBarIndex = bar_index
// Long, Short Entry Fulfilled or Already Entered
bool inLong = openLong or strategy.opentrades.size(strategy.opentrades - 1) > 0 and not closeLong
bool inShort = openShort or strategy.opentrades.size(strategy.opentrades - 1) < 0 and not closeShort
// ░░░░░░░░░░░░░░░░░░░░░░░░░░░░░░░░░░░░░░░░░░░░░░░░░░░░░░░░░░░░░░░░░░░░░░░░░░░░░░░░░░░░░░░░░░░░░░░░░░░░░░░░░░░░░░░░░░░░░░░░░░░░░░░░░░░░░░░░░░░░░░░░░░
// Stop Loss - Inputs, Indicaotrs
// ░░░░░░░░░░░░░░░░░░░░░░░░░░░░░░░░░░░░░░░░░░░░░░░░░░░░░░░░░░░░░░░░░░░░░░░░░░░░░░░░░░░░░░░░░░░░░░░░░░░░░░░░░░░░░░░░░░░░░░░░░░░░░░░░░░░░░░░░░░░░░░░░░░
//// Use SL? TSL?
i_useSLTP = input.bool (defval = true, title = "Enable SL & TP?", tooltip = "", inline = "1", group = "Stop Loss")
i_tslEnabled = input.bool (defval = false , title = "Enable Trailing SL?", tooltip = "Enable Stop Loss & Take Profit? \n\Enable Trailing SL?", inline = "1", group = "Stop Loss")
// i_breakEvenAfterTP = input.bool (defval = false, title = 'Enable Break Even After TP?', tooltip = 'When Take Profit price target is hit, move the Stop Loss to the entry price (or to a more strict price defined by the Stop Loss %/ATR Multiplier).', inline = '2', group = 'Stop Loss / Take Profit')
//// Sl Options
i_slType = input.string (defval = "ATR", title = "Stop Loss Type", options = ["Percent", "ATR", "Previous LL / HH"], tooltip = "Stop Loss based on %? ATR?", inline = "3", group = "Stop Loss")
i_slATRLen = input.int (defval = 14, title = "ATR Length", minval = 1 , maxval = 200 , step = 1, inline = "4", group = "Stop Loss")
i_slATRMult = input.float (defval = 3, title = "ATR Multiplier", minval = 1 , maxval = 200 , step = 0.1, tooltip = "", inline = "4", group = "Stop Loss")
i_slPercent = input.float (defval = 3, title = "Percent", tooltip = "", inline = "5", group = "Stop Loss")
i_slLookBack = input.int (defval = 30, title = "Lowest Price Before Entry", group = "Stop Loss", inline = "6", minval = 30, step = 1, tooltip = "Lookback to find the Lowest Price. \nStopLoss is determined by the Lowest price of the look back period. Take Profit is derived from this also by multiplying the StopLoss value by the Risk:Reward multiplier.")
// Functions for Stop Loss
float openAtr = ta.valuewhen(condition = enteringTrade, source = ta.atr(i_slATRLen), occurrence = 0)
float openLowest = ta.valuewhen(condition = openLong, source = ta.lowest(low, i_slLookBack), occurrence = 0)
float openHighest = ta.valuewhen(condition = openShort, source = ta.highest(high, i_slLookBack), occurrence = 0)
f_getLongSLPrice(source) =>
switch i_slType
"Percent" => source * (1 - (i_slPercent/100))
"ATR" => source - (i_slATRMult * openAtr)
"Previous LL / HH" => openLowest
=> na
f_getShortSLPrice(source) =>
switch i_slType
"Percent" => source * (1 + (i_slPercent/100))
"ATR" => source + (i_slATRMult * openAtr)
"Previous LL / HH" => openHighest
=> na
// Calculate Stop Loss
var float longSLPrice = na
var float shortSLPrice = na
bool longTPExecuted = false
bool shortTPExecuted = false
longSLPrice := if (inLong and i_useSLTP)
if (openLong)
f_getLongSLPrice (close)
else
// 1. Trailing Stop Loss
if i_tslEnabled
stopLossPrice = f_getLongSLPrice (high)
math.max(stopLossPrice, nz(longSLPrice[1]))
// 2. Normal StopLoss
else
nz(source = longSLPrice[1], replacement = 0)
else
na
shortSLPrice := if (inShort and i_useSLTP)
if (openShort)
f_getShortSLPrice (close)
else
// 1. Trailing Stop Loss
if i_tslEnabled
stopLossPrice = f_getShortSLPrice (low)
math.min(stopLossPrice, nz(shortSLPrice[1]))
// 2. Normal StopLoss
else
nz(source = shortSLPrice[1], replacement = 999999.9)
else
na
// Plot: Stop Loss of Long, Short Entry
var longSLPriceColor = color.new(color.maroon, 0)
plot(series = longSLPrice, title = 'Long Stop Loss', color = longSLPriceColor, linewidth = 1, style = plot.style_linebr, offset = 1)
var shortSLPriceColor = color.new(color.maroon, 0)
plot(series = shortSLPrice, title = 'Short Stop Loss', color = shortSLPriceColor, linewidth = 1, style = plot.style_linebr, offset = 1)
// ░░░░░░░░░░░░░░░░░░░░░░░░░░░░░░░░░░░░░░░░░░░░░░░░░░░░░░░░░░░░░░░░░░░░░░░░░░░░░░░░░░░░░░░░░░░░░░░░░░░░░░░░░░░░░░░░░░░░░░░░░░░░░░░░░░░░░░░░░░░░░░░░░░
// Take Profit - Inputs, Indicaotrs
// ░░░░░░░░░░░░░░░░░░░░░░░░░░░░░░░░░░░░░░░░░░░░░░░░░░░░░░░░░░░░░░░░░░░░░░░░░░░░░░░░░░░░░░░░░░░░░░░░░░░░░░░░░░░░░░░░░░░░░░░░░░░░░░░░░░░░░░░░░░░░░░░░░░
i_useTPExit = input.bool (defval = true, title = "Use Take Profit?", tooltip = "", inline = "1", group = "Take Profit")
i_RRratio = input.float (defval = 1.8, title = "R:R Ratio", minval = 0.1 , maxval = 200 , step = 0.1, tooltip = "R:R Ratio > Risk Reward Ratio? It will automatically set Take Profit % based on Stop Loss", inline = "2", group = "Take Profit")
i_tpQuantityPerc = input.float (defval = 50, title = 'Take Profit Quantity %', minval = 0.0, maxval = 100, step = 1.0, tooltip = '% of position closed when tp target is met.', inline="34", group = 'Take Profit')
var float longTPPrice = na
var float shortTPPrice = na
f_getLongTPPrice() =>
close + i_RRratio * math.abs (close - f_getLongSLPrice (close))
f_getShortTPPrice() =>
close - i_RRratio * math.abs(close - f_getShortSLPrice (close))
longTPPrice := if (inLong and i_useSLTP)
if (openLong)
f_getLongTPPrice ()
else
nz(source = longTPPrice[1], replacement = f_getLongTPPrice ())
else
na
shortTPPrice := if (inShort and i_useSLTP)
if (openShort)
f_getShortTPPrice ()
else
nz(source = shortTPPrice[1], replacement = f_getShortTPPrice ())
else
na
// Plot: Take Profit of Long, Short Entry
var longTPPriceColor = color.new(color.teal, 0)
plot(series = longTPPrice, title = 'Long Take Profit', color = longTPPriceColor, linewidth = 1, style = plot.style_linebr, offset = 1)
var shortTPPriceColor = color.new(color.teal, 0)
plot(series = shortTPPrice, title = 'Short Take Profit', color = shortTPPriceColor, linewidth = 1, style = plot.style_linebr, offset = 1)
// Plot: Entry Price
var posColor = color.new(color.white, 0)
plot(series = strategy.opentrades.entry_price(strategy.opentrades - 1), title = 'Position Entry Price', color = posColor, linewidth = 1, style = plot.style_linebr)
// ░░░░░░░░░░░░░░░░░░░░░░░░░░░░░░░░░░░░░░░░░░░░░░░░░░░░░░░░░░░░░░░░░░░░░░░░░░░░░░░░░░░░░░░░░░░░░░░░░░░░░░░░░░░░░░░░░░░░░░░░░░░░░░░░░░░░░░░░░░░░░░░░░░
// Quantity - Inputs
// ░░░░░░░░░░░░░░░░░░░░░░░░░░░░░░░░░░░░░░░░░░░░░░░░░░░░░░░░░░░░░░░░░░░░░░░░░░░░░░░░░░░░░░░░░░░░░░░░░░░░░░░░░░░░░░░░░░░░░░░░░░░░░░░░░░░░░░░░░░░░░░░░░░
i_useRiskManangement = input.bool (defval = true, title = "Use Risk Manangement?", tooltip = "", inline = "1", group = "Quantity")
i_riskPerTrade = input.float (defval = 3, title = "Risk Per Trade (%)", minval = 0, maxval = 100, step = 0.1, tooltip = "Use Risk Manangement by Quantity Control?", inline = "2", group = "Quantity")
// i_leverage = input.float (defval = 2, title = "Leverage", minval = 0, maxval = 100, step = 0.1, tooltip = "Leverage", inline = "3", group = "Quantity")
float qtyPercent = na
float entryQuantity = na
f_calQtyPerc() =>
if (i_useRiskManangement)
riskPerTrade = (i_riskPerTrade) / 100 // 1번 거래시 3% 손실
stopLossPrice = openLong ? f_getLongSLPrice (close) : openShort ? f_getShortSLPrice (close) : na
riskExpected = math.abs((close-stopLossPrice)/close) // 손절가랑 6% 차이
riskPerTrade / riskExpected // 0 ~ 1
else
1
f_calQty(qtyPerc) =>
math.min (math.max (0.000001, strategy.equity / close * qtyPerc), 1000000000)
// TP Execution
longTPExecuted := strategy.opentrades.size(strategy.opentrades - 1) > 0 and (longTPExecuted[1] or strategy.opentrades.size(strategy.opentrades - 1) < strategy.opentrades.size(strategy.opentrades - 1)[1] or strategy.opentrades.size(strategy.opentrades - 1)[1] == 0 and high >= longTPPrice)
shortTPExecuted := strategy.opentrades.size(strategy.opentrades - 1) < 0 and (shortTPExecuted[1] or strategy.opentrades.size(strategy.opentrades - 1) > strategy.opentrades.size(strategy.opentrades - 1)[1] or strategy.opentrades.size(strategy.opentrades - 1)[1] == 0 and low <= shortTPPrice)
// ░░░░░░░░░░░░░░░░░░░░░░░░░░░░░░░░░░░░░░░░░░░░░░░░░░░░░░░░░░░░░░░░░░░░░░░░░░░░░░░░░░░░░░░░░░░░░░░░░░░░░░░░░░░░░░░░░░░░░░░░░░░░░░░░░░░░░░░░░░░░░░░░░░
// Plot Label, Boxes, Results, Etc
// ░░░░░░░░░░░░░░░░░░░░░░░░░░░░░░░░░░░░░░░░░░░░░░░░░░░░░░░░░░░░░░░░░░░░░░░░░░░░░░░░░░░░░░░░░░░░░░░░░░░░░░░░░░░░░░░░░░░░░░░░░░░░░░░░░░░░░░░░░░░░░░░░░░
i_showSimpleLabel = input.bool(false, "Show Simple Label for Entry?", group = "Strategy: Drawings", inline = "1", tooltip ="")
i_showLabels = input.bool(true, "Show Trade Exit Labels", group = "Strategy: Drawings", inline = "1", tooltip = "Useful labels to identify Profit/Loss and cumulative portfolio capital after each trade closes.\n\nAlso note that TradingView limits the max number of 'boxes' that can be displayed on a chart (max 500). This means when you lookback far enough on the chart you will not see the TP/SL boxes. However you can check this option to identify where trades exited.")
i_showDashboard = input.bool(true, "Show Dashboard", group = "Strategy: Drawings", inline = "2", tooltip = "Show Backtest Results. Backtest Dates, Win/Lose Rates, Etc.")
// Plot: Label for Long, Short Entry
var openLongColor = color.new(#2962FF, 0)
var openShortColor = color.new(#FF1744, 0)
var entryTextColor = color.new(color.white, 0)
if (openLong and i_showSimpleLabel)
label.new (x = bar_index, y = na, text = 'Open', yloc = yloc.belowbar, color = openLongColor, style = label.style_label_up, textcolor = entryTextColor)
entryBarIndex := bar_index
if (openShort and i_showSimpleLabel)
label.new (x = bar_index, y = na, text = 'Close', yloc = yloc.abovebar, color = openShortColor, style = label.style_label_down, textcolor = entryTextColor)
entryBarIndex := bar_index
float prevEntryPrice = strategy.closedtrades.entry_price (strategy.closedtrades - 1)
float pnl = strategy.closedtrades.profit (strategy.closedtrades - 1)
float prevExitPrice = strategy.closedtrades.exit_price (strategy.closedtrades - 1)
f_enteringTradeLabel(x, y, qty, entryPrice, slPrice, tpPrice, rrRatio, direction) =>
if i_showLabels
labelStr = ("Trade Start"
+ "\nDirection: " + direction
+ "\nRisk Per Trade: " + str.tostring (i_useRiskManangement ? i_riskPerTrade : 100, "#.##") + "%"
+ "\nExpected Risk: " + str.tostring (math.abs((close-slPrice)/close) * 100, "#.##") + "%"
+ "\nEntry Position Qty: " + str.tostring(math.abs(qty * 100), "#.##") + "%"
+ "\nEntry Price: " + str.tostring(entryPrice, "#.##"))
+ "\nStop Loss Price: " + str.tostring(slPrice, "#.##")
+ "\nTake Profit Price: " + str.tostring(tpPrice, "#.##")
+ "\nRisk - Reward Ratio: " + str.tostring(rrRatio, "#.##")
label.new(x = x, y = y, text = labelStr, color = color.new(color.blue, 60) , textcolor = color.white, style = label.style_label_up)
f_exitingTradeLabel(x, y, entryPrice, exitPrice, direction) =>
if i_showLabels
labelStr = ("Trade Result"
+ "\nDirection: " + direction
+ "\nEntry Price: " + str.tostring(entryPrice, "#.##")
+ "\nExit Price: " + str.tostring(exitPrice,"#.##")
+ "\nGain %: " + str.tostring(direction == 'Long' ? -(entryPrice-exitPrice) / entryPrice * 100 : (entryPrice-exitPrice) / entryPrice * 100 ,"#.##") + "%")
label.new(x = x, y = y, text = labelStr, color = pnl > 0 ? color.new(color.green, 60) : color.new(color.red, 60), textcolor = color.white, style = label.style_label_down)
f_fillCell(_table, _column, _row, _title, _value, _bgcolor, _txtcolor) =>
_cellText = _title + " " + _value
table.cell(_table, _column, _row, _cellText, bgcolor=_bgcolor, text_color=_txtcolor, text_size=size.auto)
// ░░░░░░░░░░░░░░░░░░░░░░░░░░░░░░░░░░░░░░░░░░░░░░░░░░░░░░░░░░░░░░░░░░░░░░░░░░░░░░░░░░░░░░░░░░░░░░░░░░░░░░░░░░░░░░░░░░░░░░░░░░░░░░░░░░░░░░░░░░░░░░░░░░
// Orders
// ░░░░░░░░░░░░░░░░░░░░░░░░░░░░░░░░░░░░░░░░░░░░░░░░░░░░░░░░░░░░░░░░░░░░░░░░░░░░░░░░░░░░░░░░░░░░░░░░░░░░░░░░░░░░░░░░░░░░░░░░░░░░░░░░░░░░░░░░░░░░░░░░░░
if (inTime)
if (openLong)
qtyPercent := f_calQtyPerc()
entryQuantity := f_calQty(qtyPercent)
strategy.entry(id = "Long", direction = strategy.long, qty = entryQuantity, comment = 'Long(' + syminfo.ticker + '): Started', alert_message = 'Long(' + syminfo.ticker + '): Started')
f_enteringTradeLabel(x = bar_index + 1, y = close-3*ta.tr, entryPrice = close, qty = qtyPercent, slPrice = longSLPrice, tpPrice = longTPPrice, rrRatio = i_RRratio, direction = "Long")
if (openShort)
qtyPercent := f_calQtyPerc()
entryQuantity := f_calQty(qtyPercent)
strategy.entry(id = "Short", direction = strategy.short, qty = entryQuantity, comment = 'Short(' + syminfo.ticker + '): Started', alert_message = 'Short(' + syminfo.ticker + '): Started')
f_enteringTradeLabel(x = bar_index + 1, y = close-3*ta.tr, entryPrice = close, qty = qtyPercent, slPrice = shortSLPrice, tpPrice = shortTPPrice, rrRatio = i_RRratio, direction = "Short")
if (closeLong)
strategy.close(id = 'Long', comment = 'Close Long', alert_message = 'Long: Closed at market price')
strategy.position_size > 0 ? f_exitingTradeLabel(x = bar_index, y = close+3*ta.tr, entryPrice = prevEntryPrice, exitPrice = prevExitPrice, direction = 'Long') : na
if (closeShort)
strategy.close(id = 'Short', comment = 'Close Short', alert_message = 'Short: Closed at market price')
strategy.position_size < 0 ? f_exitingTradeLabel(x = bar_index, y = close+3*ta.tr, entryPrice = prevEntryPrice, exitPrice = prevExitPrice, direction = 'Short') : na
if (inLong)
strategy.exit(id = 'Long TP / SL', from_entry = 'Long', qty_percent = i_tpQuantityPerc, limit = longTPPrice, stop = longSLPrice, alert_message = 'Long(' + syminfo.ticker + '): Take Profit or Stop Loss executed')
strategy.exit(id = 'Long SL', from_entry = 'Long', stop = longSLPrice, alert_message = 'Long(' + syminfo.ticker + '): Stop Loss executed')
if (inShort)
strategy.exit(id = 'Short TP / SL', from_entry = 'Short', qty_percent = i_tpQuantityPerc, limit = shortTPPrice, stop = shortSLPrice, alert_message = 'Short(' + syminfo.ticker + '): Take Profit or Stop Loss executed')
strategy.exit(id = 'Short SL', from_entry = 'Short', stop = shortSLPrice, alert_message = 'Short(' + syminfo.ticker + '): Stop Loss executed')
if strategy.position_size[1] > 0 and strategy.position_size == 0
f_exitingTradeLabel(x = bar_index, y = close+3*ta.tr, entryPrice = prevEntryPrice, exitPrice = prevExitPrice, direction = 'Long')
if strategy.position_size[1] < 0 and strategy.position_size == 0
f_exitingTradeLabel(x = bar_index, y = close+3*ta.tr, entryPrice = prevEntryPrice, exitPrice = prevExitPrice, direction = 'Short')
// ░░░░░░░░░░░░░░░░░░░░░░░░░░░░░░░░░░░░░░░░░░░░░░░░░░░░░░░░░░░░░░░░░░░░░░░░░░░░░░░░░░░░░░░░░░░░░░░░░░░░░░░░░░░░░░░░░░░░░░░░░░░░░░░░░░░░░░░░░░░░░░░░░░
// Backtest Result Dashboard
// ░░░░░░░░░░░░░░░░░░░░░░░░░░░░░░░░░░░░░░░░░░░░░░░░░░░░░░░░░░░░░░░░░░░░░░░░░░░░░░░░░░░░░░░░░░░░░░░░░░░░░░░░░░░░░░░░░░░░░░░░░░░░░░░░░░░░░░░░░░░░░░░░░░
// if i_showDashboard
// var bgcolor = color.new(color = color.black, transp = 100)
// var greenColor = color.new(color = #02732A, transp = 0)
// var redColor = color.new(color = #D92332, transp = 0)
// var yellowColor = color.new(color = #F2E313, transp = 0)
// // Keep track of Wins/Losses streaks
// newWin = (strategy.wintrades > strategy.wintrades[1]) and (strategy.losstrades == strategy.losstrades[1]) and (strategy.eventrades == strategy.eventrades[1])
// newLoss = (strategy.wintrades == strategy.wintrades[1]) and (strategy.losstrades > strategy.losstrades[1]) and (strategy.eventrades == strategy.eventrades[1])
// varip int winRow = 0
// varip int lossRow = 0
// varip int maxWinRow = 0
// varip int maxLossRow = 0
// if newWin
// lossRow := 0
// winRow := winRow + 1
// if winRow > maxWinRow
// maxWinRow := winRow
// if newLoss
// winRow := 0
// lossRow := lossRow + 1
// if lossRow > maxLossRow
// maxLossRow := lossRow
// // Prepare stats table
// var table dashTable = table.new(position.top_right, 1, 15, border_width=1)
// if barstate.islastconfirmedhistory
// dollarReturn = strategy.netprofit
// f_fillCell(dashTable, 0, 0, "Start:", str.format("{0,date,long}", strategy.closedtrades.entry_time(0)) , bgcolor, color.white) // + str.format(" {0,time,HH:mm}", strategy.closedtrades.entry_time(0))
// f_fillCell(dashTable, 0, 1, "End:", str.format("{0,date,long}", strategy.opentrades.entry_time(0)) , bgcolor, color.white) // + str.format(" {0,time,HH:mm}", strategy.opentrades.entry_time(0))
// _profit = (strategy.netprofit / strategy.initial_capital) * 100
// f_fillCell(dashTable, 0, 2, "Net Profit:", str.tostring(_profit, '##.##') + "%", _profit > 0 ? greenColor : redColor, color.white)
// _numOfDaysInStrategy = (strategy.opentrades.entry_time(0) - strategy.closedtrades.entry_time(0)) / (1000 * 3600 * 24)
// f_fillCell(dashTable, 0, 3, "Percent Per Day", str.tostring(_profit / _numOfDaysInStrategy, '#########################.#####')+"%", _profit > 0 ? greenColor : redColor, color.white)
// _winRate = ( strategy.wintrades / strategy.closedtrades ) * 100
// f_fillCell(dashTable, 0, 4, "Percent Profitable:", str.tostring(_winRate, '##.##') + "%", _winRate < 50 ? redColor : _winRate < 75 ? greenColor : yellowColor, color.white)
// f_fillCell(dashTable, 0, 5, "Profit Factor:", str.tostring(strategy.grossprofit / strategy.grossloss, '##.###'), strategy.grossprofit > strategy.grossloss ? greenColor : redColor, color.white)
// f_fillCell(dashTable, 0, 6, "Total Trades:", str.tostring(strategy.closedtrades), bgcolor, color.white)
// f_fillCell(dashTable, 0, 8, "Max Wins In A Row:", str.tostring(maxWinRow, '######') , bgcolor, color.white)
// f_fillCell(dashTable, 0, 9, "Max Losses In A Row:", str.tostring(maxLossRow, '######') , bgcolor, color.white)