
A estratégia combina o indicador RSI e a linha de equilíbrio do preço, procurando oportunidades de superação para construir uma posição maior quando o preço da ação cai abaixo da linha de equilíbrio. À medida que o preço da ação cai ainda mais, a estratégia aumenta a posição em níveis percentuais predefinidos para atingir o objetivo do custo médio de manutenção da posição.
Quando o indicador RSI estiver abaixo da linha de superalimento 29 e o preço de fechamento estiver abaixo da linha média, faça uma primeira ordem de abertura adicional.
Quando o preço da ação atinge 2% da primeira queda, aumenta a posição; quando a queda atinge 3%, aumenta a posição pela terceira vez, e assim por diante, até um máximo de 8 posições. Isso realiza o efeito de construir uma posição em lotes.
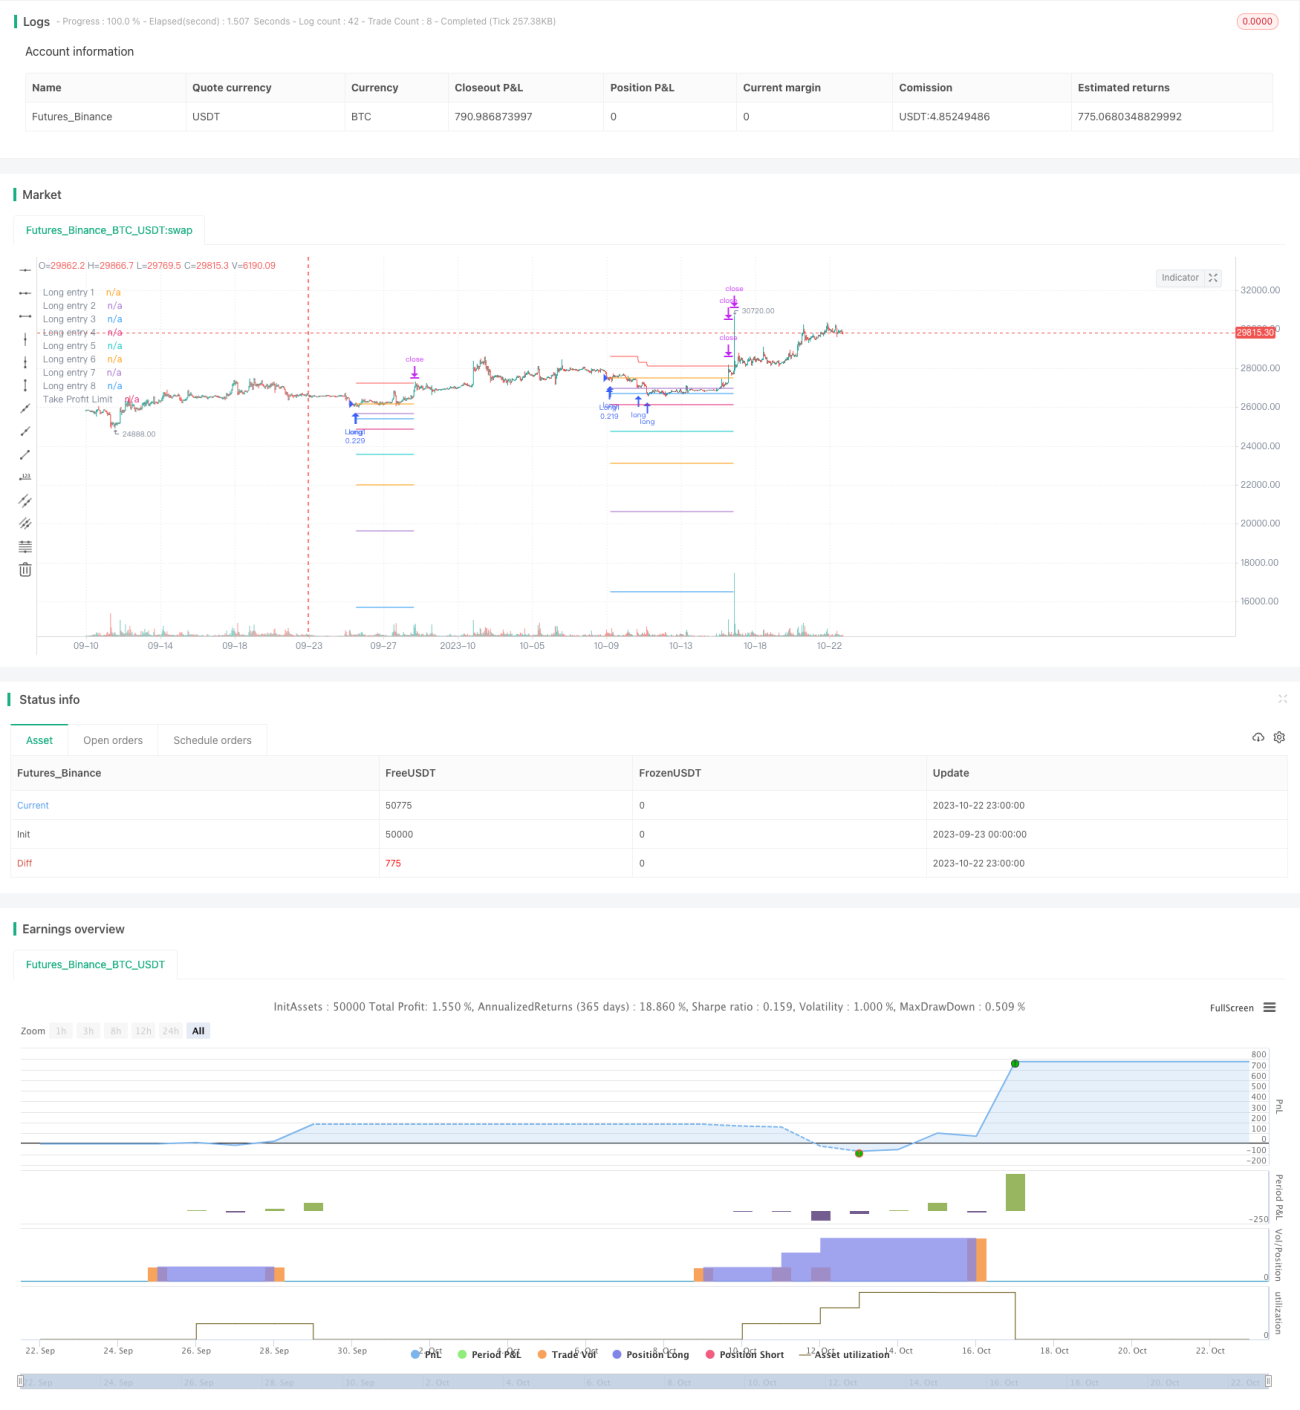
Cada vez que uma posição é aberta, o preço de abertura é registrado. Esses pontos de preço são os preços de referência para entrada. E essas linhas de preço são traçadas no gráfico.
Depois de abrir uma posição, o preço médio da posição é calculado. 3% do preço médio é o preço de parada de cada posição e 4% é o preço de parada da posição como um todo.
Quando o aumento do preço excede o preço de parada de uma posição, a posição é liquidada.
O método de cálculo do stop-loss progressivo é o seguinte: a cada liquidação de uma posição, o lucro obtido pela posição é deduzido do preço de stop-loss geral. Isso permite que a linha de stop-loss desça lentamente e só seja totalmente cancelada quando os lucros de todas as posições são suficientes para compensar o máximo de perdas.
Quando o preço desencadeia um stop-loss progressivo, escolha a posição zero.
O indicador RSI pode ser usado para determinar com mais precisão as zonas de superalimento, ajudando a aproveitar as oportunidades de reversão.
O custo médio de um estoque pode ser estimado em pontos baixos, com várias acumulações de estoque.
A parada gradual pode reduzir o risco de perdas e alcançar a saída gradual. Mesmo que os perdas ocorram, eles podem ser controlados até certo ponto.
Proporções de stop loss e de alavancagem configuráveis, que podem ser ajustadas de acordo com o risco estratégico do mercado
O gráfico mostra as linhas de referência de abertura e de encerramento das posições, permitindo intuir a distribuição das posições.
Em situações de turbulência, pode-se acionar várias aberturas e paradas de posição, e as transações costumam causar perdas de ponto de deslizamento. Pode-se relaxar adequadamente os parâmetros RSI, reduzindo o número de transações.
O número e a proporção inadequados de adições podem levar a excessos de negociação, que devem ser cuidadosamente configurados de acordo com a situação do capital.
Se o mercado continuar a cair, pode haver um risco sem fim. Deve-se prever um limite máximo para o número de acréscimos, e a última camada de acréscimo deve ser conservadora.
Se a proporção de parada for muito pequena, pode causar parada prematura. Deverá ser definida uma proporção de parada apropriada com base nos dados de retrospecção histórica.
Pode-se introduzir indicadores como MACD para filtrar os sinais RSI, reduzindo a negociação inválida.
O ATR pode ser configurado para evitar grandes perdas em situações extremas.
Pode-se otimizar parâmetros como o número de acréscimos, a proporção e a proporção de suspensão, para que a estratégia seja mais adequada a diferentes variedades.
A proporção de travamento pode ser ajustada de acordo com a taxa de flutuação inteligente, com uma flexibilidade apropriada quando a flutuação é grande.
A estratégia aproveita ao máximo o indicador RSI para determinar áreas de venda excessiva, em conjunto com a linha de preço para a negociação de reversão. Ao mesmo tempo, o uso de armazenamento inteligente e mecanismo de parada gradual, sob a premissa de controlar o risco, para realizar uma estratégia de multitarefa altamente eficiente.
/*backtest
start: 2023-09-23 00:00:00
end: 2023-10-23 00:00:00
period: 1h
basePeriod: 15m
exchanges: [{"eid":"Futures_Binance","currency":"BTC_USDT"}]
*/
// This source code is subject to the terms of the Mozilla Public License 2.0 at https://mozilla.org/MPL/2.0/
//@version=5
// © A3Sh
// RSI Strategy that buys the dips, uses Price Averaging and Pyramiding.
// When the price drops below specified percentages of the price (8 PA layers), new entries are openend to average the price of the assets.
// Open entries are closed by a specified take profit.
// Entries can be reopened, after closing and consequently crossing a PA layer again.
// This strategy is based on the RSI+PA+DCA strategy I created earlier. The difference is the way the Take Profit is calculated.
// Instead of directly connecting the take profit limit to the decreasing average price level with an X percent above the average price,
// the take profit is calculated for a part on the decreasing average price and for another part on the deduction
// of the profits of the individual closed positions.
// The Take Profit Limit drop less significant then the average price level and the full position only completely exits
// when enough individual closed positions made up for the losses.
// This makes it less risky and more conservative and great for a long term trading strategy
// RSI code is adapted from the build in Relative Strength Index indicator
// MA Filter and RSI concept adapted from the Optimized RSI Buy the Dips strategy, by Coinrule
// https://www.tradingview.com/script/Pm1WAtyI-Optimized-RSI-Strategy-Buy-The-Dips-by-Coinrule/
// Pyramiding entries code adapted from Pyramiding Entries on Early Trends startegy, by Coinrule
// https://www.tradingview.com/script/7NNJ0sXB-Pyramiding-Entries-On-Early-Trends-by-Coinrule/
// Plot entry layers code adapted from HOWTO Plot Entry Price by vitvlkv
// https://www.tradingview.com/script/bHTnipgY-HOWTO-Plot-Entry-Price/
strategy(title='RSI+PA+PTP', pyramiding=16, overlay=true, initial_capital=400, default_qty_type=strategy.percent_of_equity, default_qty_value=15, commission_type=strategy.commission.percent, commission_value=0.075, close_entries_rule='FIFO')
port = input.float(12, group = "Risk", title='Portfolio % Used To Open The 8 Positions', step=0.1, minval=0.1, maxval=100)
q = strategy.equity / 100 * port / open
// Long position PA entry layers. Percentage from the entry price of the the first long
ps2 = input.float(2, group = "Long Position Entry Layers", title='2nd Long Entry %', step=0.1)
ps3 = input.float(3, group = "Long Position Entry Layers", title='3rd Long Entry %', step=0.1)
ps4 = input.float(5, group = "Long Position Entry Layers", title='4th Long Entry %', step=0.1)
ps5 = input.float(10, group = "Long Position Entry Layers", title='5th Long Entry %', step=0.1)
ps6 = input.float(16, group = "Long Position Entry Layers", title='6th Long Entry %', step=0.1)
ps7 = input.float(25, group = "Long Position Entry Layers" ,title='7th Long Entry %', step=0.1)
ps8 = input.float(40, group = "Long Position Entry Layers", title='8th Long Entry %', step=0.1)
// Calculate Moving Averages
plotMA = input.bool(group = "Moving Average Filter", title='Plot Moving Average', defval=false)
movingaverage_signal = ta.sma(close, input(100, group = "Moving Average Filter", title='MA Length'))
plot (plotMA ? movingaverage_signal : na, color = color.new (color.green, 0))
// RSI inputs and calculations
rsiLengthInput = input.int(14, minval=1, title="RSI Length", group="RSI Settings")
rsiSourceInput = input.source(close, "Source", group="RSI Settings")
up = ta.rma(math.max(ta.change(rsiSourceInput), 0), rsiLengthInput)
down = ta.rma(-math.min(ta.change(rsiSourceInput), 0), rsiLengthInput)
rsi = down == 0 ? 100 : up == 0 ? 0 : 100 - (100 / (1 + up / down))
overSold = input.int(29, title="Oversold, Trigger to Enter First Position", group = "RSI Settings")
// Long trigger (co)
co = ta.crossover(rsi, overSold) and close < movingaverage_signal
// Store values to create and plot the different PA layers
long1 = ta.valuewhen(co, close, 0)
long2 = ta.valuewhen(co, close - close / 100 * ps2, 0)
long3 = ta.valuewhen(co, close - close / 100 * ps3, 0)
long4 = ta.valuewhen(co, close - close / 100 * ps4, 0)
long5 = ta.valuewhen(co, close - close / 100 * ps5, 0)
long6 = ta.valuewhen(co, close - close / 100 * ps6, 0)
long7 = ta.valuewhen(co, close - close / 100 * ps7, 0)
long8 = ta.valuewhen(co, close - close / 100 * ps8, 0)
eps1 = 0.00
eps1 := na(eps1[1]) ? na : eps1[1]
eps2 = 0.00
eps2 := na(eps2[1]) ? na : eps2[1]
eps3 = 0.00
eps3 := na(eps3[1]) ? na : eps3[1]
eps4 = 0.00
eps4 := na(eps4[1]) ? na : eps4[1]
eps5 = 0.00
eps5 := na(eps5[1]) ? na : eps5[1]
eps6 = 0.00
eps6 := na(eps6[1]) ? na : eps6[1]
eps7 = 0.00
eps7 := na(eps7[1]) ? na : eps7[1]
eps8 = 0.00
eps8 := na(eps8[1]) ? na : eps8[1]
plot(strategy.position_size > 0 ? eps1 : na, title='Long entry 1', style=plot.style_linebr)
plot(strategy.position_size > 0 ? eps2 : na, title='Long entry 2', style=plot.style_linebr)
plot(strategy.position_size > 0 ? eps3 : na, title='Long entry 3', style=plot.style_linebr)
plot(strategy.position_size > 0 ? eps4 : na, title='Long entry 4', style=plot.style_linebr)
plot(strategy.position_size > 0 ? eps5 : na, title='Long entry 5', style=plot.style_linebr)
plot(strategy.position_size > 0 ? eps6 : na, title='Long entry 6', style=plot.style_linebr)
plot(strategy.position_size > 0 ? eps7 : na, title='Long entry 7', style=plot.style_linebr)
plot(strategy.position_size > 0 ? eps8 : na, title='Long entry 8', style=plot.style_linebr)
// Take Profit Settings
ProfitTarget_Percent = input.float(3.0, group = "Take Profit Settings", title='Take Profit % (Per Position)')
ProfitTarget_Percent_All = input.float(4.0, group = "Take Profit Settings", title='Take Profit % (Exit All, Progressive Take Profit Limit')
TakeProfitProgression = input.float(12, group = "Take Profit Settings", title='Take Profit Progression', tooltip = 'Progression is defined by the position size. By default 12% of the start equity (portfolio) is used to open a position, see Risk. This same % percentage is used to calculate the profit amount that will be deducted from the Take Profit Limit.')
entryOn = input.bool (true, group = "Take Profit Settings", title='New entries affect Take Profit limit', tooltip = 'This option changes the behaviour of the Progressive Take Profit. When switchted on, the difference between the former and current original Take Profit is deducted from the Progressive Take Profit. When switchted off, the Progressive Take Profit is only affected by the profit deduction or each closed position.')
avPricePlot = input.bool (false, group = "Take Profit Settings", title='Plot Average Price (FIFO)')
// Original Take Profit Limit
tpLimit = strategy.position_avg_price + (strategy.position_avg_price / 100 * ProfitTarget_Percent_All)
// Create variables to calculate the Take Profit Limit Progresssion
var endVal = 0.0
var startVal = 0.0
// The value at the the start of the loop is the value of the end of the previous loop
startVal := endVal
// Set variable to the original Take Profit Limit when the first position opens.
if strategy.position_size > 0 and strategy.position_size[1] ==0
endVal := tpLimit
// Everytime a specific position opens, the difference of the previous (original) Take Profit price and the current (original) Take Profit price will be deducted from the Progressive Take Profit Limit
// This feature can be toggled on and off in the settings panel. By default it is toggled on.
entryAmount = 0.0
for i = 1 to strategy.opentrades
entryAmount := i
if entryOn and strategy.position_size > 0 and strategy.opentrades[1] == (entryAmount) and strategy.opentrades == (entryAmount + 1)
endVal := startVal - (tpLimit[1] - tpLimit)
// Everytime a specific position closes, the amount of profit from that specific position will be deducted from the Progressive Take Profit Limit.
exitAmount = 0.0
for id = 1 to strategy.opentrades
exitAmount := id
if strategy.opentrades[1] ==(exitAmount + 1) and strategy.opentrades == (exitAmount)
endVal := startVal - (TakeProfitProgression / 100 * strategy.opentrades.entry_price (id - 1) / 100 * ProfitTarget_Percent )
// The Final Take Profit Price
tpn = (strategy.position_avg_price + (strategy.position_avg_price / 100 * ProfitTarget_Percent_All)) - (strategy.position_avg_price + (strategy.position_avg_price / 100 * ProfitTarget_Percent_All) - endVal)
plot (strategy.position_size > 0 ? tpn : na, title = "Take Profit Limit", color=color.new(color.red, 0), style = plot.style_linebr, linewidth = 1)
// Plot position average price as reference
plot (avPricePlot ? strategy.position_avg_price : na, title= "Average price", color = color.new(color.white, 0), style = plot.style_linebr, linewidth = 1)
// When to trigger the Take Profit per position or the Progressive Take Profit
tpl1 = close < tpn ? eps1 + close * (ProfitTarget_Percent / 100) : tpn
tpl2 = close < tpn ? eps2 + close * (ProfitTarget_Percent / 100) : tpn
tpl3 = close < tpn ? eps3 + close * (ProfitTarget_Percent / 100) : tpn
tpl4 = close < tpn ? eps4 + close * (ProfitTarget_Percent / 100) : tpn
tpl5 = close < tpn ? eps5 + close * (ProfitTarget_Percent / 100) : tpn
tpl6 = close < tpn ? eps6 + close * (ProfitTarget_Percent / 100) : tpn
tpl7 = close < tpn ? eps7 + close * (ProfitTarget_Percent / 100) : tpn
tpl8 = close < tpn ? eps8 + close * (ProfitTarget_Percent / 100) : tpn
// Submit Entry Orders
if co and strategy.opentrades == 0
eps1 := long1
eps2 := long2
eps3 := long3
eps4 := long4
eps5 := long5
eps6 := long6
eps7 := long7
eps8 := long8
strategy.entry('Long1', strategy.long, q)
if strategy.opentrades == 1
strategy.entry('Long2', strategy.long, q, limit=eps2)
if strategy.opentrades == 2
strategy.entry('Long3', strategy.long, q, limit=eps3)
if strategy.opentrades == 3
strategy.entry('Long4', strategy.long, q, limit=eps4)
if strategy.opentrades == 4
strategy.entry('Long5', strategy.long, q, limit=eps5)
if strategy.opentrades == 5
strategy.entry('Long6', strategy.long, q, limit=eps6)
if strategy.opentrades == 6
strategy.entry('Long7', strategy.long, q, limit=eps7)
if strategy.opentrades == 7
strategy.entry('Long8', strategy.long, q, limit=eps8)
// Submit Exit orders
if strategy.position_size > 0
strategy.exit(id='Exit 1', from_entry='Long1', limit=tpl1)
strategy.exit(id='Exit 2', from_entry='Long2', limit=tpl2)
strategy.exit(id='Exit 3', from_entry='Long3', limit=tpl3)
strategy.exit(id='Exit 4', from_entry='Long4', limit=tpl4)
strategy.exit(id='Exit 5', from_entry='Long5', limit=tpl5)
strategy.exit(id='Exit 6', from_entry='Long6', limit=tpl6)
strategy.exit(id='Exit 7', from_entry='Long7', limit=tpl7)
strategy.exit(id='Exit 8', from_entry='Long8', limit=tpl8)
// Make sure that all open limit orders are canceled after exiting all the positions
longClose = strategy.position_size[1] > 0 and strategy.position_size == 0 ? 1 : 0
if longClose
strategy.cancel_all()