
A estratégia combina os benefícios da estratégia de ruptura e da estratégia de parada de tendência para capturar os sinais de ruptura de resistência de suporte no gráfico de linha longa e, ao mesmo tempo, usar a média móvel para rastrear a perda de parada para obter lucro na direção da tendência de linha longa e controlar o risco.
A estratégia começa com o cálculo de médias móveis de vários grupos de diferentes parâmetros, usados como julgamento de tendências, resistência de suporte e rastreamento de stop loss.
Em seguida, identifique os pontos mais altos e mais baixos dentro do período especificado como áreas de resistência de suporte para entrar. Quando o preço quebra esses pontos de resistência de suporte, o sinal é gerado.
A estratégia consiste em comprar com o ponto mais alto de ruptura para fazer um sinal mais, e vender com o ponto mais baixo de ruptura para fazer um sinal mais baixo.
Depois de entrar em campo, a posição é mantida com o ponto mais baixo do ponto mais baixo do ponto mais baixo.
Quando a posição entra em lucro, o ponto de parada é transferido para o seguimento da média móvel. Quando o preço cai abaixo da média móvel, o ponto de parada é definido como o ponto mais baixo da linha K da raiz.
O que é mais importante, é que o mercado de ações está em alta, o que significa que o mercado de ações está em alta, o que significa que o mercado de ações está em alta.
A estratégia também inclui oscilações reais médias para garantir que as compras de ruptura sejam feitas apenas em intervalos apropriados, evitando rupturas de expansão excessiva.
A combinação de estratégias de ruptura e estratégias de parada de tendências traz vantagens duplas.
A partir daí, você pode comprar breakouts de acordo com a tendência da linha longa, aumentando a probabilidade de lucro.
A estratégia de stop loss protege a posição, mas também dá espaço suficiente para a posição funcionar.
Adição de filtros de flutuação para evitar rupturas adversas de elevação excessiva
Automatização de transações, para a cobrança de parte do tempo.
Pode-se personalizar a linha média de diferentes períodos para operação.
O método de rastreamento de perda de energia pode ser ajustado de forma flexível.
A estratégia de ruptura é propensa a falsos riscos de ruptura. A confirmação de ruptura pode ser liberada de forma apropriada.
O sinal de ruptura é produzido por um fluxo suficiente, que é facilmente invalido em situações de subversão.
Alguns avanços podem ser demasiado breves para serem capturados.
O tracking stop pode ocorrer com muita frequência em situações de tremor. A distância de parada pode ser adequadamente relaxada.
O filtro de taxa de flutuação pode ter perdido algumas oportunidades. Pode-se reduzir o parâmetro de filtragem.
Teste diferentes combinações de parâmetros de linha média para encontrar o melhor parâmetro.
Teste diferentes mecanismos de confirmação de ruptura, como canais, formas de linha K, etc.
Tente diferentes métodos de rastreamento de perda para encontrar a melhor perda.
Otimizar estratégias de gestão de fundos, como a pontuação de positivos.
Adição de filtros de indicadores técnicos estatísticos para melhorar a precisão de filtragem.
Teste a eficácia da estratégia em diferentes variedades.
A inclusão de algoritmos de aprendizagem de máquina para melhorar a eficácia da estratégia.
A estratégia integra o pensamento de ruptura e o pensamento de parada de rastreamento de tendências, o que permite otimizar o espaço de lucro, desde que o julgamento da linha de longo seja correto. A chave é encontrar o melhor conjunto de parâmetros e trabalhar com uma boa estratégia de gerenciamento de fundos para aproveitar as oportunidades de longo prazo e, ao mesmo tempo, controlar o risco.
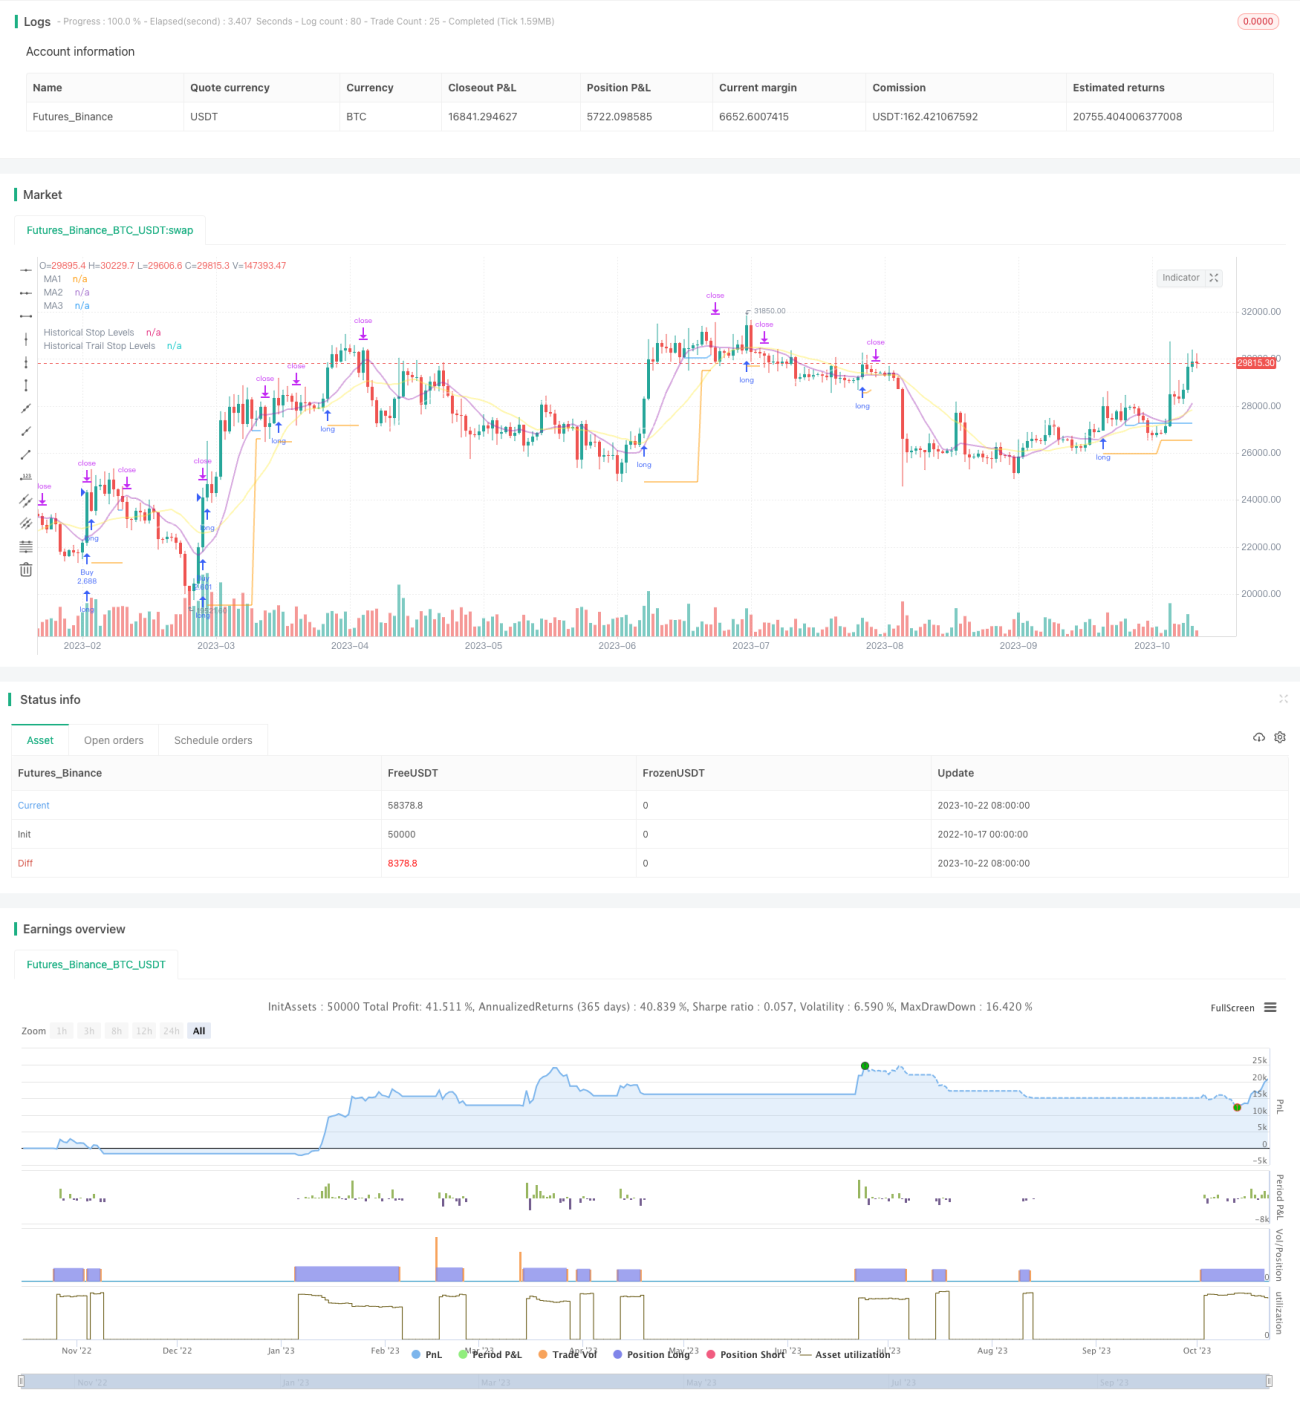
/*backtest
start: 2022-10-17 00:00:00
end: 2023-10-23 00:00:00
period: 1d
basePeriod: 1h
exchanges: [{"eid":"Futures_Binance","currency":"BTC_USDT"}]
*/
// This source code is subject to the terms of the Mozilla Public License 2.0 at https://mozilla.org/MPL/2.0/
// © millerrh
// The intent of this strategy is to buy breakouts with a tight stop on smaller timeframes in the direction of the longer term trend.
// Then use a trailing stop of a close below either the 10 MA or 20 MA (user choice) on that larger timeframe as the position
// moves in your favor (i.e. whenever position price rises above the MA).
// Option of using daily ADR as a measure of finding contracting ranges and ensuring a decent risk/reward.
// (If the difference between the breakout point and your stop level is below a certain % of ATR, it could possibly find those consolidating periods.)
// V2 - updates code of original Qullamaggie Breakout to optimize and debug it a bit - the goal is to remove some of the whipsaw and poor win rate of the
// original by incorporating some of what I learned in the Breakout Trend Follower script.
//@version=4
strategy("Qullamaggie Breakout V2", overlay=true, initial_capital=100000, currency='USD', calc_on_every_tick = true,
default_qty_type=strategy.percent_of_equity, default_qty_value=100, commission_type=strategy.commission.percent, commission_value=0.1)
// === BACKTEST RANGE ===
Start = input(defval = timestamp("01 Jan 2019 06:00 +0000"), title = "Backtest Start Date", type = input.time, group = "backtest window and pivot history")
Finish = input(defval = timestamp("01 Jan 2100 00:00 +0000"), title = "Backtest End Date", type = input.time, group = "backtest window and pivot history")
// Inputs
showPivotPoints = input(title = "Show Historical Pivot Points?", type = input.bool, defval = false, group = "backtest window and pivot history",
tooltip = "Toggle this on to see the historical pivot points that were used. Change the Lookback Periods to adjust the frequency of these points.")
htf = input(defval="D", title="Timeframe of Moving Averages", type=input.resolution, group = "moving averages",
tooltip = "Allows you to set a different time frame for the moving averages and your trailing stop.
The default behavior is to identify good tightening setups on a larger timeframe
(like daily) and enter the trade on a breakout occuring on a smaller timeframe, using the moving averages of the larger timeframe to trail your stop.")
maType = input(defval="SMA", options=["EMA", "SMA"], title = "Moving Average Type", group = "moving averages")
ma1Length = input(defval = 10, title = "1st Moving Average Length", minval = 1, group = "moving averages")
ma2Length = input(defval = 20, title = "2nd Moving Average Length", minval = 1, group = "moving averages")
ma3Length = input(defval = 50, title = "3rd Moving Average Length", minval = 1, group = "moving averages")
useMaFilter = input(title = "Use 3rd Moving Average for Filtering?", type = input.bool, defval = true, group = "moving averages",
tooltip = "Signals will be ignored when price is under this slowest moving average. The intent is to keep you out of bear periods and only
buying when price is showing strength or trading with the longer term trend.")
trailMaInput = input(defval="1st Moving Average", options=["1st Moving Average", "2nd Moving Average"], title = "Trailing Stop", group = "stops",
tooltip = "Initial stops after entry follow the range lows. Once in profit, the trade gets more wiggle room and
stops will be trailed when price breaches this moving average.")
trailMaTF = input(defval="Same as Moving Averages", options=["Same as Moving Averages", "Same as Chart"], title = "Trailing Stop Timeframe", group = "stops",
tooltip = "Once price breaches the trail stop moving average, the stop will be raised to the low of that candle that breached. You can choose to use the
chart timeframe's candles breaching or use the same timeframe the moving averages use. (i.e. if daily, you wait for the daily bar to close before setting
your new stop level.)")
currentColorS = input(color.new(color.orange,50), title = "Current Range S/R Colors: Support", type = input.color, group = "stops", inline = "lineColor")
currentColorR = input(color.new(color.blue,50), title = " Resistance", type = input.color, group = "stops", inline = "lineColor")
// Pivot lookback
lbHigh = 3
lbLow = 3
// MA Calculations (can likely move this to a tuple for a single security call!!)
ma(maType, src, length) =>
maType == "EMA" ? ema(src, length) : sma(src, length) //Ternary Operator (if maType equals EMA, then do ema calc, else do sma calc)
ma1 = security(syminfo.tickerid, htf, ma(maType, close, ma1Length))
ma2 = security(syminfo.tickerid, htf, ma(maType, close, ma2Length))
ma3 = security(syminfo.tickerid, htf, ma(maType, close, ma3Length))
plot(ma1, color=color.new(color.purple, 60), style=plot.style_line, title="MA1", linewidth=2)
plot(ma2, color=color.new(color.yellow, 60), style=plot.style_line, title="MA2", linewidth=2)
plot(ma3, color=color.new(color.white, 60), style=plot.style_line, title="MA3", linewidth=2)
// === USE ADR FOR FILTERING ===
// The idea here is that you want to buy in a consolodating range for best risk/reward. So here you can compare the current distance between
// support/resistance vs. the ADR and make sure you aren't buying at a point that is too extended.
useAdrFilter = input(title = "Use ADR for Filtering?", type = input.bool, defval = false, group = "adr filtering",
tooltip = "Signals will be ignored if the distance between support and resistance is larger than a user-defined percentage of ADR (or monthly volatility
in the stock screener). This allows the user to ensure they are not buying something that is too extended and instead focus on names that are consolidating more.")
adrPerc = input(defval = 120, title = "% of ADR Value", minval = 1, group = "adr filtering")
tableLocation = input(defval="Bottom", options=["Top", "Bottom"], title = "ADR Table Visibility", group = "adr filtering",
tooltip = "Place ADR table on the top of the pane, the bottom of the pane, or off.")
adrValue = security(syminfo.tickerid, "D", sma((high-low)/abs(low) * 100, 21)) // Monthly Volatility in Stock Screener (also ADR)
adrCompare = (adrPerc * adrValue) / 100
// === PLOT SWING HIGH/LOW AND MOST RECENT LOW TO USE AS STOP LOSS EXIT POINT ===
ph = pivothigh(high, lbHigh, lbHigh)
pl = pivotlow(low, lbLow, lbLow)
highLevel = valuewhen(ph, high[lbHigh], 0)
lowLevel = valuewhen(pl, low[lbLow], 0)
barsSinceHigh = barssince(ph) + lbHigh
barsSinceLow = barssince(pl) + lbLow
timeSinceHigh = time[barsSinceHigh]
timeSinceLow = time[barsSinceLow]
//Removes color when there is a change to ensure only the levels are shown (i.e. no diagonal lines connecting the levels)
pvthis = fixnan(ph)
pvtlos = fixnan(pl)
hipc = change(pvthis) != 0 ? na : color.new(color.maroon, 0)
lopc = change(pvtlos) != 0 ? na : color.new(color.green, 0)
// Display Pivot lines
plot(showPivotPoints ? pvthis : na, color=hipc, linewidth=1, offset=-lbHigh, title="Top Levels")
plot(showPivotPoints ? pvthis : na, color=hipc, linewidth=1, offset=0, title="Top Levels 2")
plot(showPivotPoints ? pvtlos : na, color=lopc, linewidth=1, offset=-lbLow, title="Bottom Levels")
plot(showPivotPoints ? pvtlos : na, color=lopc, linewidth=1, offset=0, title="Bottom Levels 2")
// BUY AND SELL CONDITIONS
buyLevel = valuewhen(ph, high[lbHigh], 0) //Buy level at Swing High
// Conditions for entry
stopLevel = float(na) // Define stop level here as "na" so that I can reference it in the ADR calculation before the stopLevel is actually defined.
buyConditions = (useMaFilter ? buyLevel > ma3 : true) and
(useAdrFilter ? (buyLevel - stopLevel[1]) < adrCompare : true)
buySignal = crossover(high, buyLevel) and buyConditions
// Trailing stop points - when price punctures the moving average, move stop to the low of that candle - Define as function/tuple to only use one security call
trailMa = trailMaInput == "1st Moving Average" ? ma1 : ma2
f_getCross() =>
maCrossEvent = crossunder(low, trailMa)
maCross = valuewhen(maCrossEvent, low, 0)
maCrossLevel = fixnan(maCross)
maCrossPc = change(maCrossLevel) != 0 ? na : color.new(color.blue, 0) //Removes color when there is a change to ensure only the levels are shown (i.e. no diagonal lines connecting the levels)
[maCrossEvent, maCross, maCrossLevel, maCrossPc]
crossTF = trailMaTF == "Same as Moving Averages" ? htf : ""
[maCrossEvent, maCross, maCrossLevel, maCrossPc] = security(syminfo.tickerid, crossTF, f_getCross())
plot(showPivotPoints ? maCrossLevel : na, color = maCrossPc, linewidth=1, offset=0, title="Ma Stop Levels")
// == STOP AND PRICE LEVELS ==
inPosition = strategy.position_size > 0
buyLevel := inPosition ? buyLevel[1] : buyLevel
stopDefine = valuewhen(pl, low[lbLow], 0) //Stop Level at Swing Low
inProfit = strategy.position_avg_price <= stopDefine[1]
// stopLevel := inPosition ? stopLevel[1] : stopDefine // Set stop loss based on swing low and leave it there
stopLevel := inPosition and not inProfit ? stopDefine : inPosition and inProfit ? stopLevel[1] : stopDefine // Trail stop loss until in profit
trailStopLevel = float(na)
// trying to figure out a better way for waiting on the trail stop - it can trigger if above the stopLevel even if the MA hadn't been breached since opening the trade
notInPosition = strategy.position_size == 0
inPositionBars = barssince(notInPosition)
maCrossBars = barssince(maCrossEvent)
trailCross = inPositionBars > maCrossBars
// trailCross = trailMa > stopLevel
trailStopLevel := inPosition and trailCross ? maCrossLevel : na
plot(inPosition ? stopLevel : na, style=plot.style_linebr, color=color.new(color.orange, 50), linewidth = 2, title = "Historical Stop Levels", trackprice=false)
plot(inPosition ? trailStopLevel : na, style=plot.style_linebr, color=color.new(color.blue, 50), linewidth = 2, title = "Historical Trail Stop Levels", trackprice=false)
// == PLOT SUPPORT/RESISTANCE LINES FOR CURRENT CHART TIMEFRAME ==
// Use a function to define the lines
// f_line(x1, y1, y2, _color) =>
// var line id = na
// line.delete(id)
// id := line.new(x1, y1, time, y2, xloc.bar_time, extend.right, _color)
// highLine = f_line(timeSinceHigh, highLevel, highLevel, currentColorR)
// lowLine = f_line(timeSinceLow, lowLevel, lowLevel, currentColorS)
// == ADR TABLE ==
tablePos = tableLocation == "Top" ? position.top_right : position.bottom_right
var table adrTable = table.new(tablePos, 2, 1, border_width = 3)
lightTransp = 90
avgTransp = 80
heavyTransp = 70
posColor = color.rgb(38, 166, 154)
negColor = color.rgb(240, 83, 80)
volColor = color.new(#999999, 0)
f_fillCellVol(_table, _column, _row, _value) =>
_transp = abs(_value) > 7 ? heavyTransp : abs(_value) > 4 ? avgTransp : lightTransp
_cellText = tostring(_value, "0.00") + "%\n" + "ADR"
table.cell(_table, _column, _row, _cellText, bgcolor = color.new(volColor, _transp), text_color = volColor, width = 6)
srDistance = (highLevel - lowLevel)/highLevel * 100
f_fillCellCalc(_table, _column, _row, _value) =>
_c_color = _value >= adrCompare ? negColor : posColor
_transp = _value >= adrCompare*0.8 and _value <= adrCompare*1.2 ? lightTransp :
_value >= adrCompare*0.5 and _value < adrCompare*0.8 ? avgTransp :
_value < adrCompare*0.5 ? heavyTransp :
_value > adrCompare*1.2 and _value <= adrCompare*1.5 ? avgTransp :
_value > adrCompare*1.5 ? heavyTransp : na
_cellText = tostring(_value, "0.00") + "%\n" + "Range"
table.cell(_table, _column, _row, _cellText, bgcolor = color.new(_c_color, _transp), text_color = _c_color, width = 6)
if barstate.islast
f_fillCellVol(adrTable, 0, 0, adrValue)
f_fillCellCalc(adrTable, 1, 0, srDistance)
// f_fillCellVol(adrTable, 0, 0, inPositionBars)
// f_fillCellCalc(adrTable, 1, 0, maCrossBars)
// == STRATEGY ENTRY AND EXIT ==
strategy.entry("Buy", strategy.long, stop = buyLevel, when = buyConditions)
stop = stopLevel > trailStopLevel ? stopLevel : close[1] > trailStopLevel and close[1] > trailMa ? trailStopLevel : stopLevel
strategy.exit("Sell", from_entry = "Buy", stop=stop)