Estratégia de rompimento do RSI de acumulação

Visão geral
A estratégia utiliza a identificação de tendências no indicador RSI acumulado para comprar e vender quando o indicador RSI acumulado ultrapassa o limite crítico. A estratégia pode filtrar efetivamente o ruído do mercado e bloquear as oportunidades de negociação de tendências mais longas.
Princípio da estratégia
A estratégia baseia-se principalmente em um indicador RSI cumulativo para tomar decisões de negociação. O indicador RSI cumulativo é o valor acumulado do indicador RSI. Ao definir o parâmetro cumlen, os valores do indicador RSI podem ser acumulados em dias cumulativos para obter o indicador RSI cumulativo.
Quando o indicador RSI acumulado atravessa a banda de Bollinger, a operação de compra e abertura de posição é realizada; Quando o indicador RSI acumulado atravessa a banda de Bollinger, a operação de venda de posição é realizada. A banda de Bollinger é calculada por vários anos de dados históricos e é o preço de referência para mudanças dinâmicas.
Além disso, a estratégia também adicionou a opção de filtro de tendência. A compra e abertura de posições são feitas apenas quando o preço está acima da média móvel de 100 dias, ou seja, no canal ascendente da tendência. Este filtro evita transações erradas quando os preços são agitados.
Vantagens estratégicas
- Utilizando o indicador RSI cumulativo para filtrar eficazmente o ruído e bloquear a tendência de linha média e longa
- Aumentar os filtros de tendências para evitar transações irracionais
- Utilize preços de referência dinâmicos de ruptura em vez de valores fixos para julgar
- Parâmetros mais configuráveis, que podem ser ajustados para diferentes mercados
- A retrospectiva de 10 anos foi excelente, com ganhos muito maiores do que a estratégia de compra e posse.
Riscos e melhorias estratégicas
- A estratégia baseia-se apenas em um único indicador para tomar decisões sobre o RSI acumulado, podendo adicionar outros indicadores de julgamento ou filtros para um julgamento integrado
- Nível de alavancagem de multiplicador fixo mais elevado, com uma taxa de alavancagem ajustável em função da retirada
- A ideia é que os estudantes possam trabalhar em várias direções e considerar a possibilidade de aumentar o número de vagas.
- Combinação de parâmetros otimizáveis, com variações significativas de configuração de parâmetros em diferentes condições de mercado
- Enriquecer as condições de equilíbrio, aumentar a posição de parada, mover a parada, etc.
- Pode ser considerado em combinação com outras estratégias para obter efeitos sinérgicos
Resumir
A estratégia de ruptura do RSI acumulado funciona de forma fluida e lógica, aumenta o julgamento de tendências com o uso de indicadores RSI acumulados, é preciso para entender as tendências de linha média e longa e tem um excelente desempenho de retrospectiva histórica. No entanto, ainda há espaço para otimização, que pode começar a partir da configuração de parâmetros de ajuste, aumento de indicadores de julgamento e enriquecimento de condições de equilíbrio.
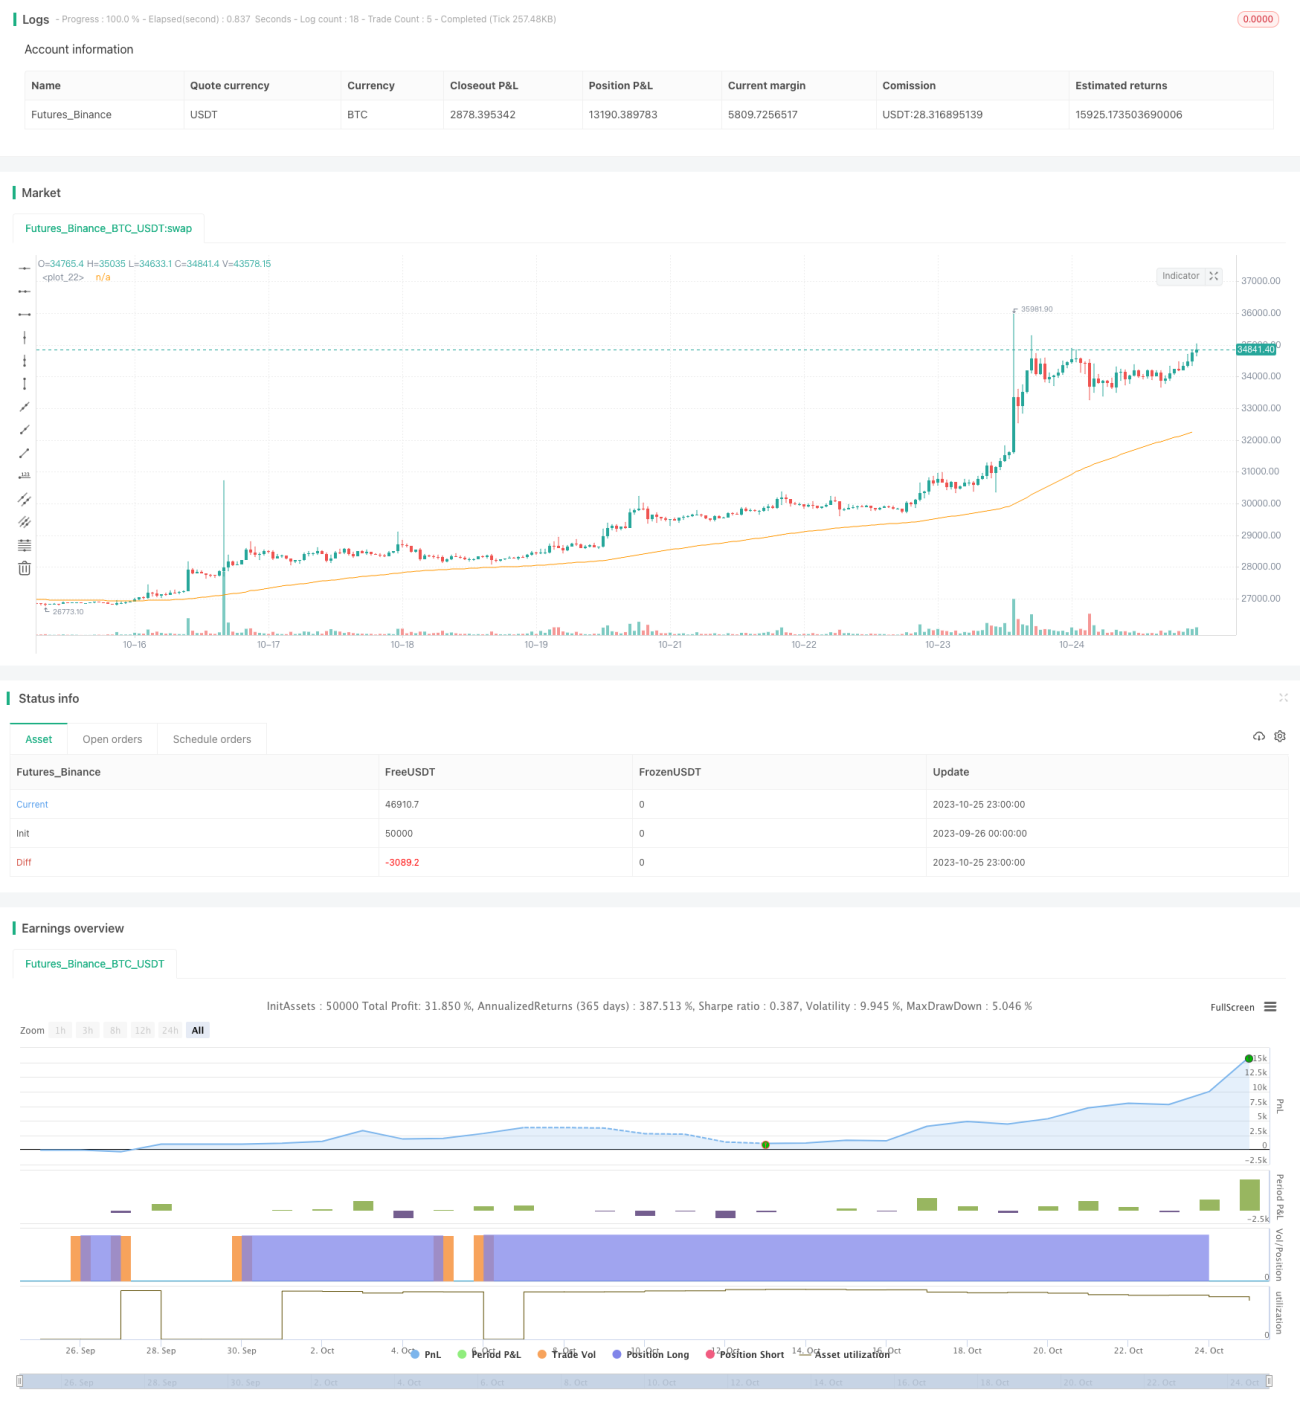
/*backtest
start: 2023-09-26 00:00:00
end: 2023-10-26 00:00:00
period: 1h
basePeriod: 15m
exchanges: [{"eid":"Futures_Binance","currency":"BTC_USDT"}]
*/

// This source code is subject to the terms of the Mozilla Public License 2.0 at https://mozilla.org/MPL/2.0/
// @version=5
// Author = TradeAutomation
- 1