Estratégia de lucro multi-timeframe

Visão geral
A estratégia visa realizar o gerenciamento de paradas em vários períodos de tempo. A estratégia utiliza simultaneamente paradas de porcentagem e paradas de áreas de preço-chave acima dos períodos de tempo principais, para gerenciamento de paradas mais preciso e eficaz.
Princípio da estratégia
A estratégia introduziu primeiro o indicador de tendência de ondas, com entrada de múltiplos sinais de acordo com o indicador Gold Forks.
No que diz respeito à gestão de bloqueios, a estratégia utiliza dois tipos de bloqueio:
-
Parâmetros de porcentagem: Configure vários parâmetros de porcentagem do preço de entrada.
-
Paradas de quadros de tempo múltiplos: trace uma linha média sobre a linha diária e a linha de 4 horas, e pegue o preço dessas linhas médias como o preço de parada.
Para a parada percentual, a estratégia define 4 preços de parada percentual diferentes. Quando o preço toca cada preço de parada, a posição é parcialmente liquidada de acordo com a porcentagem definida.
Para paradas de quadros de tempo múltiplos, a estratégia é traçar a média de 100 dias e a média de 200 dias, respectivamente, na linha diária e na linha de 4 horas. Pegue o preço dessas linhas médias como o preço de parada e feche a posição quando o preço atingir.
Além disso, a estratégia também estabelece um preço de stop loss. Quando o preço é inferior ao preço de stop loss, todos os posicionamentos são eliminados.
Toda a estratégia permite um gerenciamento mais abrangente e refinado do tempo de espera, através da combinação de um tempo de espera percentual e um tempo de espera de múltiplos quadros.
Vantagens estratégicas
-
O uso de um percentual de esterilização, de acordo com uma proporção fixa de esterilização, para evitar esterilização prematura ou insuficiente.
-
Com a análise de multi-quadros de tempo, é possível definir preços de parada mais precisos e escolher pontos de parada melhores.
-
A redução do risco pode ser feita por meio da aplicação de vários níveis de estímulo, que podem ser divididos em grupos.
-
Estabelecer um preço de stop loss para controlar o risco de queda.
-
A combinação de estenose por percentual e estenose por multi-quadros de tempo permite uma estenose mais completa e mais refinada.
Análise de Riscos
-
A porcentagem de parada depende da configuração dos parâmetros, e se os parâmetros forem mal definidos, isso pode causar parada prematura ou tardia.
-
A análise de multi-quadros de tempo depende do indicador de linha média, que tem um certo atraso e pode se desviar.
-
A configuração errada do ponto de parada pode causar uma parada desnecessária.
-
Os parâmetros precisam ser apropriadamente otimizados para obter a melhor correspondência entre a estenose porcentual e a estenose por múltiplos períodos de tempo.
Direção de otimização
-
Pode-se testar mais indicadores de média, escolhendo a média mais favorável como o preço de parada-chave.
-
Pode-se experimentar métodos de previsão de modelos, prevendo áreas críticas de preços como preços de parada.
-
Pode-se introduzir mais regras de bloqueio, como proporção de bloqueio esperado, bloqueio móvel, etc., para que o bloqueio seja mais abrangente.
-
Pode testar o parâmetro de paralisação da porcentagem ideal em diferentes períodos de posse.
-
Pode-se otimizar os parâmetros de suspensão por meio da retrospectiva, tornando o risco-benefício geral superior.
Resumir
Esta estratégia permite um gerenciamento de parada flexível e preciso por meio da combinação de parada porcentual e parada por vários períodos de tempo. A estratégia possui vantagens como uma melhor escolha do ponto de parada e uma parada mais abrangente.
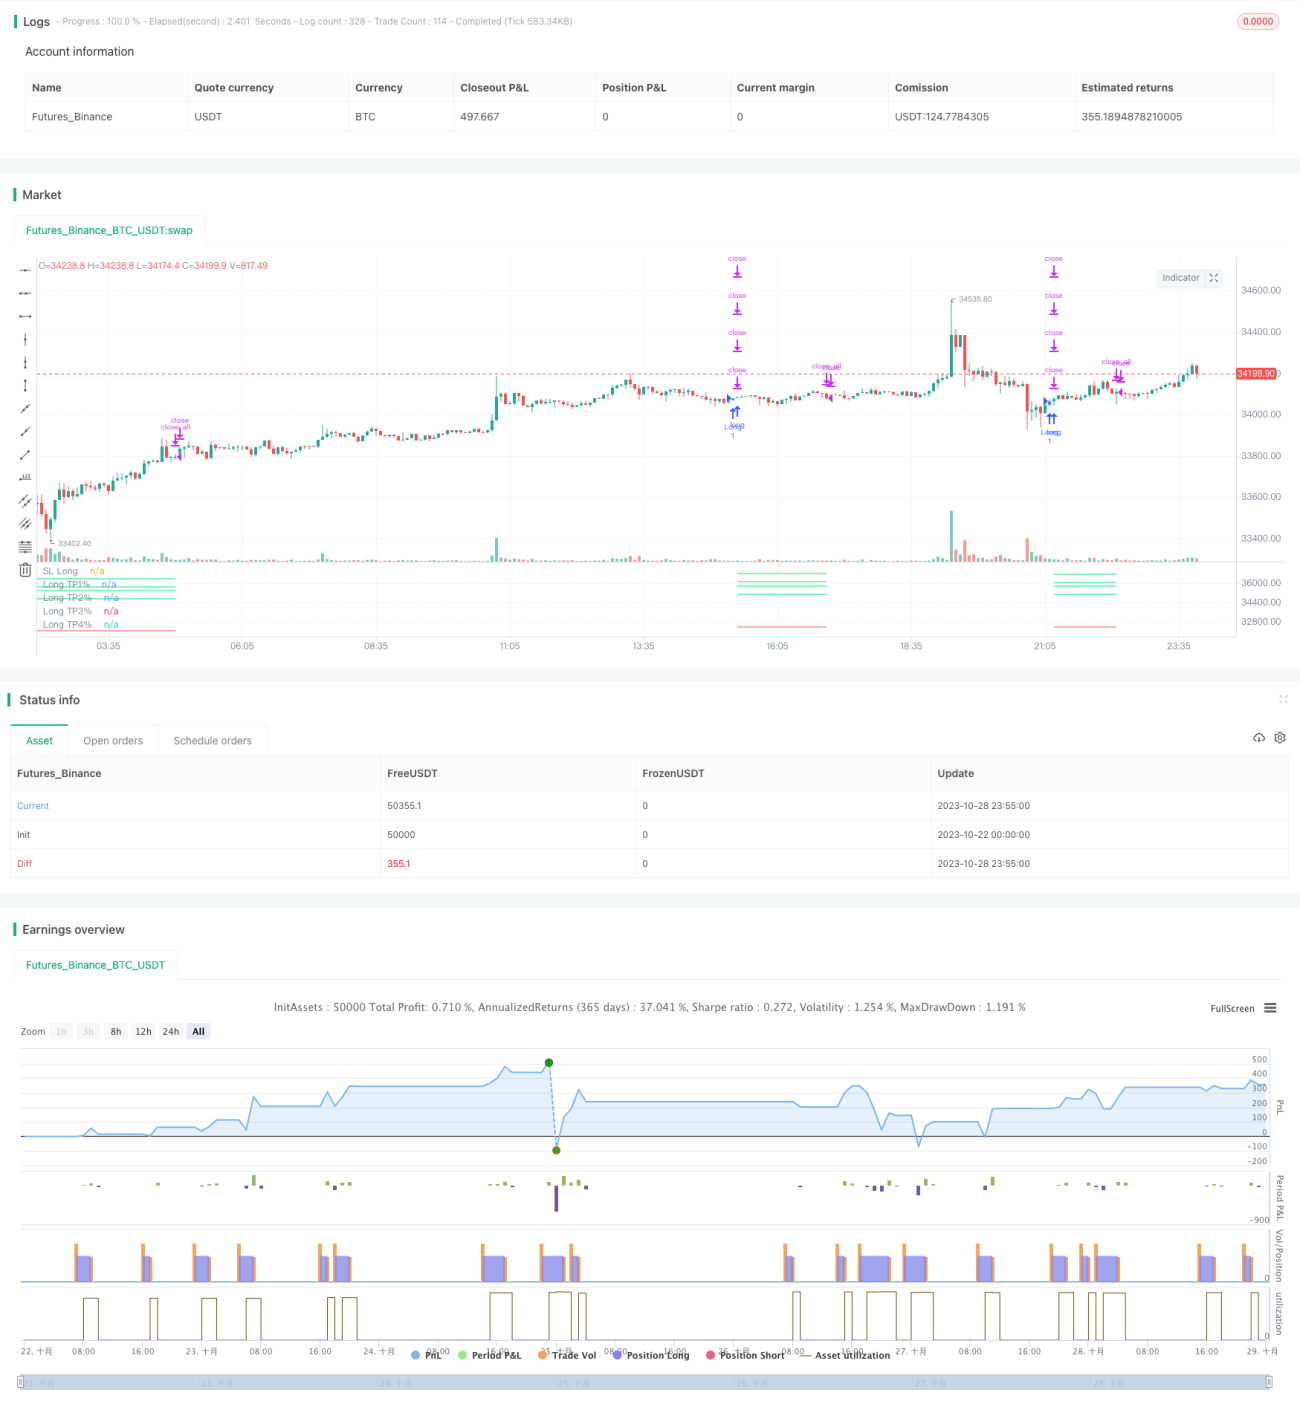
/*backtest
start: 2023-10-22 00:00:00
end: 2023-10-29 00:00:00
period: 5m
basePeriod: 1m
exchanges: [{"eid":"Futures_Binance","currency":"BTC_USDT"}]
*/

// This source code is subject to the terms of the Mozilla Public License 2.0 at https://mozilla.org/MPL/2.0/
// © TrendCrypto2022
//@version=5
// strategy("Take profit Multi timeframe", overlay=true, margin_long=100, margin_short=100)- 1