Estratégia de rompimento de média móvel de alto nível

Visão geral
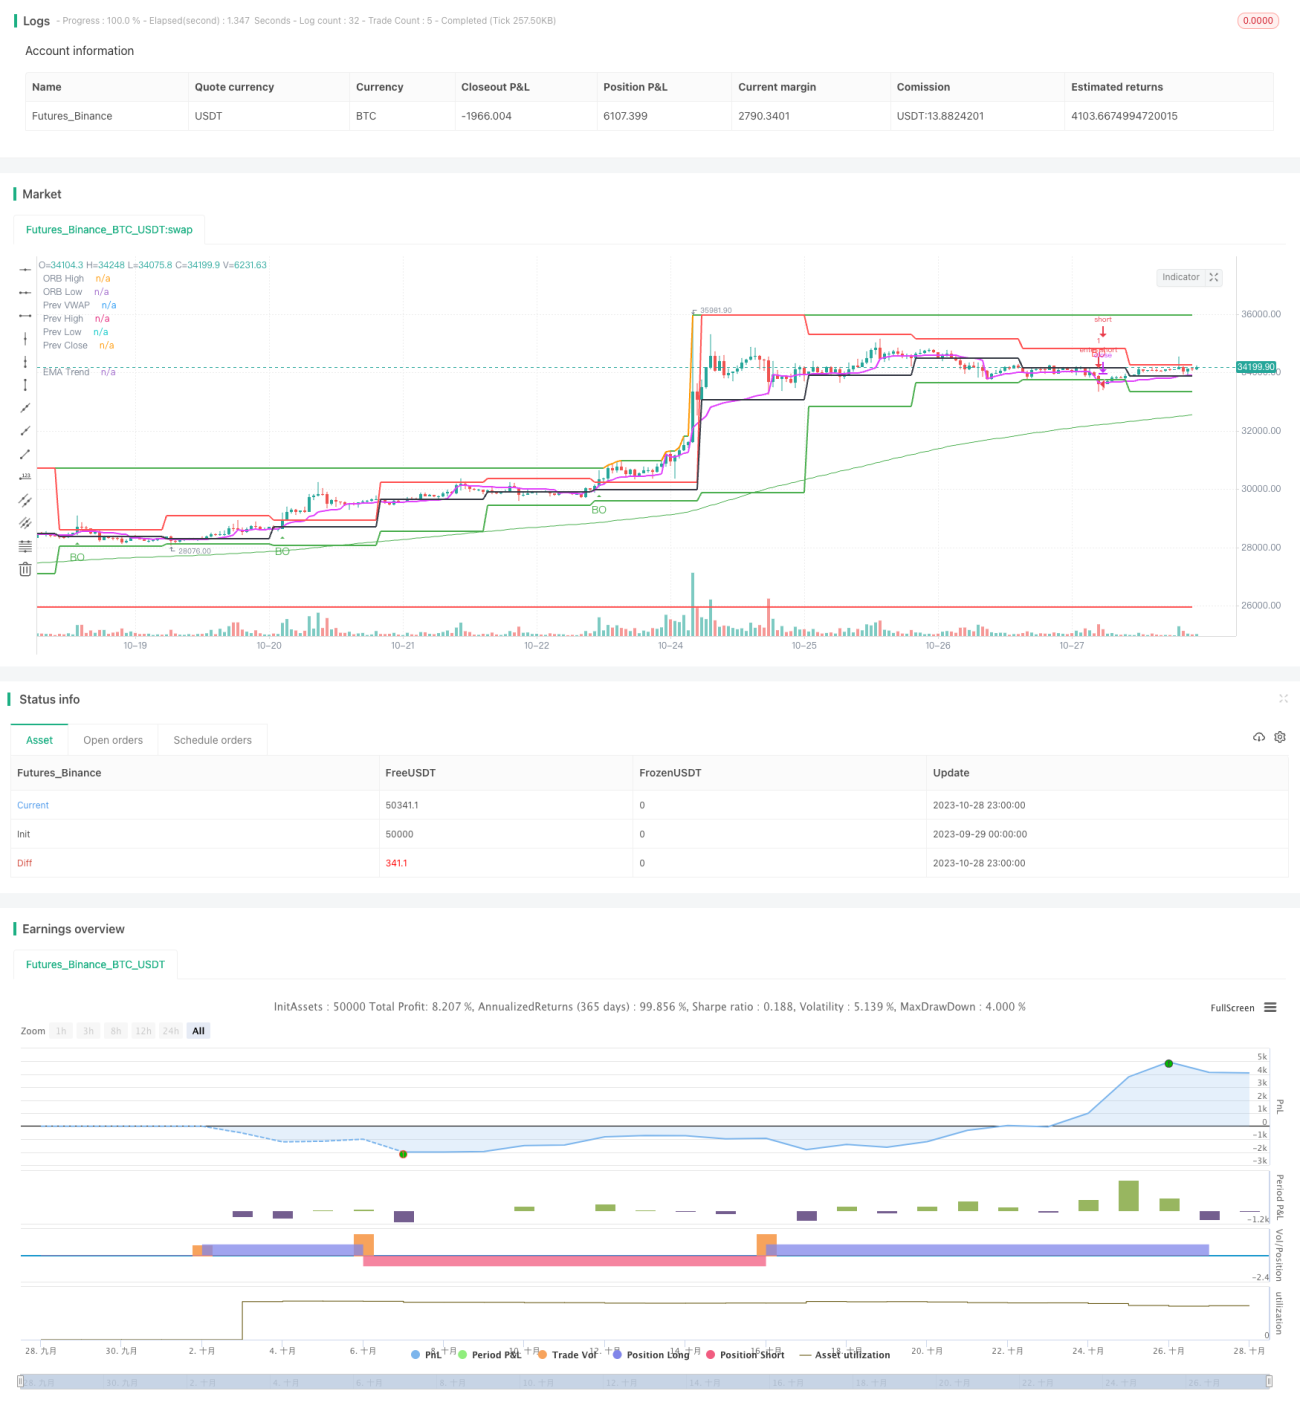
A principal ideia da estratégia é usar a ruptura da linha média do nível superior para realizar a negociação de tendências. No período de tempo do nível superior, quando o preço quebra a linha média para cima ou para baixo, pode-se determinar o início da tendência, que pode ser seguido na direção apropriada.
Princípio da estratégia
A estratégia foi desenvolvida através da linguagem Pine Script e tem como principais componentes:
-
Parâmetros de entrada
Period é o parâmetro de período médio definido, com o valor padrão de 200; K é o parâmetro de período de tempo definido, com o valor padrão de dia "D".
-
Cálculo da linha média
Calcule a média móvel exponencial usando a função ta.ema.
-
Uma ruptura no julgamento
Use as funções ta.crossover e ta.crossunder para determinar se o preço quebra ou fica abaixo da linha média.
-
Mapa de sinais
Quando ocorrer uma ruptura, trace uma seta para cima ou para baixo na linha K.
-
Transações em posição de equilíbrio
A brecha ocorre quando a posição é aberta de forma seletiva e a distância de stop-loss é duplicada e a posição é liquidada.
A estratégia baseia-se principalmente na capacidade de discernimento de tendências de nível superior, e é uma estratégia de ruptura mais tradicional, que permite o acompanhamento de tendências por meio de operações de ruptura simples.
Análise de vantagens
A estratégia tem as seguintes vantagens:
-
O conceito é simples, fácil de entender e de dominar.
-
A regulação de parâmetros é simples, com base apenas em um indicador de linha média.
-
A operação de ruptura é fácil de criar tendências e não é frequente.
-
Os ciclos de alto nível mostram claramente as grandes tendências e não são facilmente afetados por oscilações de curto prazo.
-
É possível configurar diferentes combinações de períodos de tempo para diferentes variedades.
-
A maioria das espécies de peixes não são capturadas, mas podem ser facilmente rastreadas por várias espécies, o que dificulta a sua captura.
Análise de Riscos
A estratégia também apresenta alguns riscos:
-
O mercado de criptomoedas é um mercado de criptomoedas, e os criptomoedas não são criptomoedas, mas criptomoedas.
-
Não é possível tirar proveito de oportunidades de curta duração.
-
A perda pode ser muito maior quando a direção erra em seu julgamento.
-
Quando o ciclo da linha média não coincide com o ciclo de negociação, ocorrem situações de excesso de negociação ou perda.
-
Não é possível parar os prejuízos em tempo real, e é mais provável que os prejuízos aumentem.
As soluções para o risco incluem: combinação de indicadores de tendência, aumento das condições de filtragem, redução apropriada do período de detenção, ajuste dinâmico da posição de parada, etc.
Direção de otimização
A estratégia pode ser melhorada nos seguintes aspectos:
-
Aumentar a combinação de indicadores de tendência, como MACD, KD, etc., para aumentar a confiabilidade da ruptura.
-
Aumentar o volume de transações ou condições de filtragem como o canal de linhas de Brin para evitar falsas brechas.
-
Optimizar a correspondência dos períodos de parâmetros para que os períodos de posse correspondam melhor aos períodos de tendência.
-
Aumentar as estratégias de stop loss em tempo real para controlar as perdas individuais por meio do rastreamento de stop loss.
-
Considere a otimização dinâmica dos parâmetros, combinando a tecnologia de aprendizagem de máquina.
-
Tente uma variedade de portfólios de distribuição de ativos para aumentar a estabilidade geral.
Resumir
A estratégia é geralmente simples e prática, com um simples rompimento da linha de equilíbrio para realizar o acompanhamento da tendência, é fácil de dominar e pode ser usada como uma das estratégias de entrada para a negociação quantitativa. Mas também há alguns problemas que precisam ser melhorados por meio de indicadores combinados, parâmetros de otimização, stop loss dinâmico, etc., para tornar a estratégia mais estável e eficiente.
- 1