Estratégia de Otimização de Cruzamento EMAC

Visão Geral
A estratégia otimizada de cruzamento de médias móveis exponenciais (EMAC) é uma versão aprimorada da estratégia EMAC básica após otimização de parâmetros. Esta estratégia combina julgamento de tendência, filtragem de múltiplas médias e saída com stop loss e take profit, visando capturar tendências de médio e longo prazo acompanhando a tendência.
Princípio da Estratégia
-
Determinar a direção recente da tendência: Calcular a variação percentual do preço de fechamento nos últimos 26 períodos, classificando como alta, baixa ou lateral.
-
Filtragem de múltiplas médias móveis: Calcular as EMAs de 10, 20 e 34 períodos. Quando elas cruzarem acima da SMA de 50 períodos, gerar sinal de compra.
-
Stop Loss via ATR: Quando o sinal de entrada aparece, o stop loss é definido como o ponto mais baixo ou mais alto da barra de entrada menos 2,5 ATR.
-
Stop Loss Móvel: Conforme o preço sobe, a linha de stop loss é gradualmente ajustada para cima.
-
Take Profit por Meta: Quando o sinal de entrada aparece, a meta é definida como o preço de fechamento atual mais 3 ATR.
-
Saída por Reversão na Média Móvel: Quando o preço recua abaixo da EMA de 10 períodos, ocorre a saída ativa com stop loss.
Vantagens da Estratégia
-
A filtragem de múltiplas médias móveis aumenta a confiabilidade dos sinais, evitando falsos rompimentos.
-
O uso de stop loss baseado em ATR permite definir distâncias razoáveis de acordo com a volatilidade do mercado.
-
O stop loss móvel sobe gradualmente, protegendo parte dos lucros.
-
O take profit por meta define metas de lucro razoáveis, sem ganância, evitando devolver os lucros.
-
A saída por reversão na média móvel permite sair a tempo quando a tendência se inverte.
Riscos da Estratégia e Soluções
-
Em mercados laterais, as EMAs podem gerar múltiplos cruzamentos, aumentando o risco de perdas consecutivas. É possível aumentar os parâmetros das EMAs ou adicionar filtros de cruzamento de médias para reduzir essa probabilidade.
-
Quando o valor do ATR é alto, a distância do stop loss se torna excessiva, aumentando o risco de perda. Pode-se otimizar usando a média móvel do ATR ou multiplicando o ATR por um fator de redução.
-
Não considera o risco de gaps noturnos. É possível adicionar lógica para identificar períodos de fechamento noturno, evitando sinais em horários não negociáveis.
-
Não leva em conta a influência do mercado geral. Pode-se incluir o julgamento da tendência do mercado geral como uma das condições de ativação da estratégia, reduzindo perdas em cenários desfavoráveis.
Direções de Otimização
-
Testar diferentes combinações de períodos das EMAs para encontrar as mais adequadas para cada ativo.
-
Testar o uso da média móvel do ATR ou fatores de redução para otimizar a distância do stop loss.
-
Adicionar lógica de identificação de períodos de fechamento noturno para mitigar o risco de gaps.
-
Incluir julgamento da tendência do mercado geral, configurando condições de desligamento quando o mercado estiver desfavorável.
-
Realizar testes retrospectivos em dados históricos de vários anos para selecionar combinações de parâmetros que proporcionem a melhor estabilidade nos backtests.
Resumo
A estratégia otimizada de cruzamento de médias móveis exponenciais combina julgamento de tendência, filtragem de múltiplas médias e stop loss/take profit dinâmicos, visando acompanhar tendências de médio e longo prazo para manter posições por períodos prolongados. Em comparação com a versão original, esta versão otimizada pode oferecer melhor desempenho em tempo real. No entanto, a estratégia ainda precisa de mais otimização e aprimoramento, adicionando mais lógicas de julgamento para lidar com diversas condições de mercado, reduzir riscos em operações reais e melhorar a estabilidade e a lucratividade da estratégia.
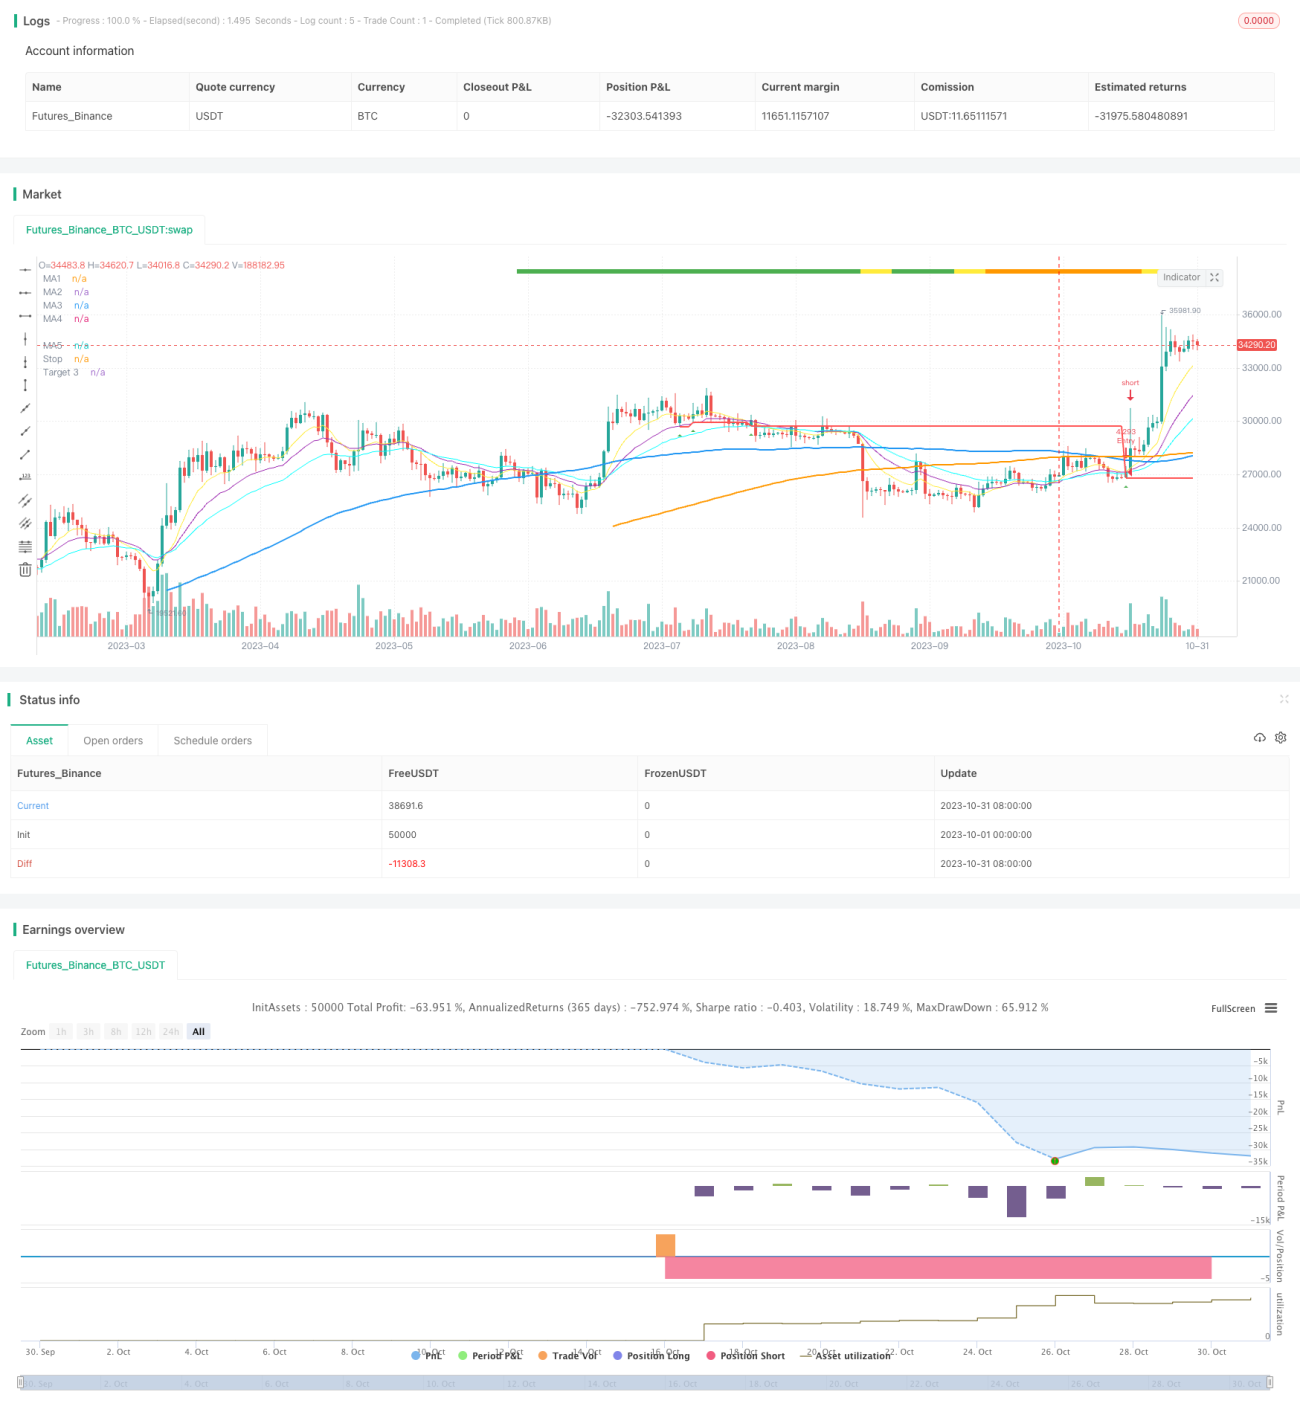
/*backtest
start: 2023-10-01 00:00:00
end: 2023-10-31 23:59:59
period: 1d
basePeriod: 1h
exchanges: [{"eid":"Futures_Binance","currency":"BTC_USDT"}]
*/

//@version=4
//Author = Dustin Drummond https://www.tradingview.com/u/Dustin_D_RLT/
//Strategy based in part on original 10ema Basic Swing Trade Strategy by Matt Delong: https://www.tradingview.com/u/MattDeLong/
//Link to original 10ema Basic Swing Trade Strategy: https://www.tradingview.com/script/8yhGnGCM-10ema-Basic-Swing-Trade-Strategy/- 1