Double Super Trend Seguindo a Estratégia de Stop Loss

Visão geral
Esta estratégia é baseada em um índice super forte de média móvel plana e um índice relativamente forte, o mecanismo de duplo seguimento de tendência foi projetado para determinar com precisão a tendência do mercado e definir um ponto de parada de perda razoável. A estratégia tem o ponto de parada de acompanhamento de tendência, o ponto de parada de acordo com a tendência e o julgamento de tendência dupla.
Princípio da estratégia
-
Calcule a Super Tendência para determinar a direção da tendência principal. A Super Tendência permite determinar a direção da tendência com precisão e fornece o ponto de entrada ideal.
-
O RSI é um indicador de tendência auxiliar. Quando o RSI é alto, é uma zona de superaquecimento, representando uma tendência de mercado de touros. Quando o RSI é baixo, é uma zona de superaquecimento, representando uma tendência de mercado de touros.
-
Faça mais quando o preço de fechamento cruzar a média móvel do índice de movimentação do índice de movimentação do índice de movimentação do índice de movimentação do índice de movimentação do índice de movimentação do índice de movimentação do índice de movimentação do índice de movimentação do índice de movimentação do índice de movimentação do índice de movimentação do índice de movimentação do índice de movimentação do índice de movimentação do índice de movimentação do índice de movimentação do índice de movimentação do índice de movimentação do índice de movimentação do índice de movimentação do índice de movimentação do índice de movimentação do índice de movimentação do índice de movimentação do índice de movimentação do índice de movimentação do índice de movimentação do índice de movimentação do índice de movimentação do índice de movimentação do índice de movimentação do índice de movimentação do índice de movimentação do
-
Estabelecer um ponto de parada de perda razoável. Quando você faz excessos, use a média móvel de deslizamento do índice ultra-forte como linha de parada de perda, com a média móvel de deslizamento do índice ultra-forte mais um ponto de parada de lucro razoável; quando você faz um período de espera, use a média móvel de deslizamento do índice ultra-forte como linha de parada de perda, com a média móvel de deslizamento do índice ultra-forte menos um ponto de parada de lucro razoável.
-
O ponto de parada flutua com as flutuações do mercado. Se o mercado se desenvolve na direção favorável, a linha de parada move-se na direção favorável, garantindo o lucro.
-
Quando o RSI está de acordo com a direção da média móvel do índice super forte, indica que a tendência atual é forte, e a estratégia só entra em jogo. Quando o RSI não está de acordo com a direção da média móvel do índice super forte, indica a possibilidade de uma reversão de tendência, e a estratégia é temporariamente desligada.
Análise de vantagens
-
O mecanismo de julgamento de tendências duplas reduz os sinais errados e aumenta a estabilidade da estratégia.
-
O ponto de parada move-se com a tendência, o que maximiza o bloqueio de lucros e evita a parada prematura.
-
O uso do RSI pode filtrar alguns sinais de negociação fracos.
-
A posição de parada deve ser razoavelmente definida para maximizar os lucros.
-
Os parâmetros da estratégia são ajustáveis e podem ser otimizados de acordo com diferentes variedades e características do mercado.
-
A estratégia de retração é controlada e possui uma forte capacidade de gerenciamento de risco.
Análise de Riscos
-
Se houver um evento inesperado, como uma notícia política importante, o mercado pode sofrer uma forte oscilação, levando ao rompimento do ponto de parada e causando um grande prejuízo. O ponto de parada pode ser relaxado adequadamente, ou sair do campo antes do surgimento de um evento de grande risco.
-
A configuração inadequada dos parâmetros pode levar a uma configuração imprudente do ponto de parada, ampliando os prejuízos ou reduzindo os lucros. A combinação ideal de parâmetros pode ser encontrada por meio de testes repetitivos.
-
Durante a fase de confusão multi-espaço, o RSI e o índice de movimentação suave do índice super-forte podem se desviar, causando um sinal de negociação errado para a estratégia. Neste momento, é possível não negociar temporariamente e esperar a entrada de uma tendência clara.
Direção de otimização
-
Optimizar os parâmetros do ciclo ATR para que sejam mais adequados às características de diferentes variedades.
-
Otimizar a configuração dos parâmetros do RSI para encontrar condições de avaliação de tendências auxiliares mais estáveis e confiáveis.
-
Em combinação com outros indicadores de julgamento, como a faixa de Brin, KDJ, etc., define uma base de entrada e saída mais precisa.
-
Teste diferentes estratégias de bloqueio, como bloqueio de rastreamento, bloqueio de escadas, bloqueio de linha de sombra, etc., para otimizar o nível de ganho.
-
Ajustar a estratégia de gerenciamento de posições de acordo com os resultados do feedback, reduzindo o risco de transação individual.
Resumir
Esta estratégia tem uma forte estabilidade e capacidade de lucro contínuo. O mecanismo de julgamento de tendências duplas pode filtrar o ruído de forma eficaz, a estratégia de stop loss pode bloquear o lucro e controlar o risco.
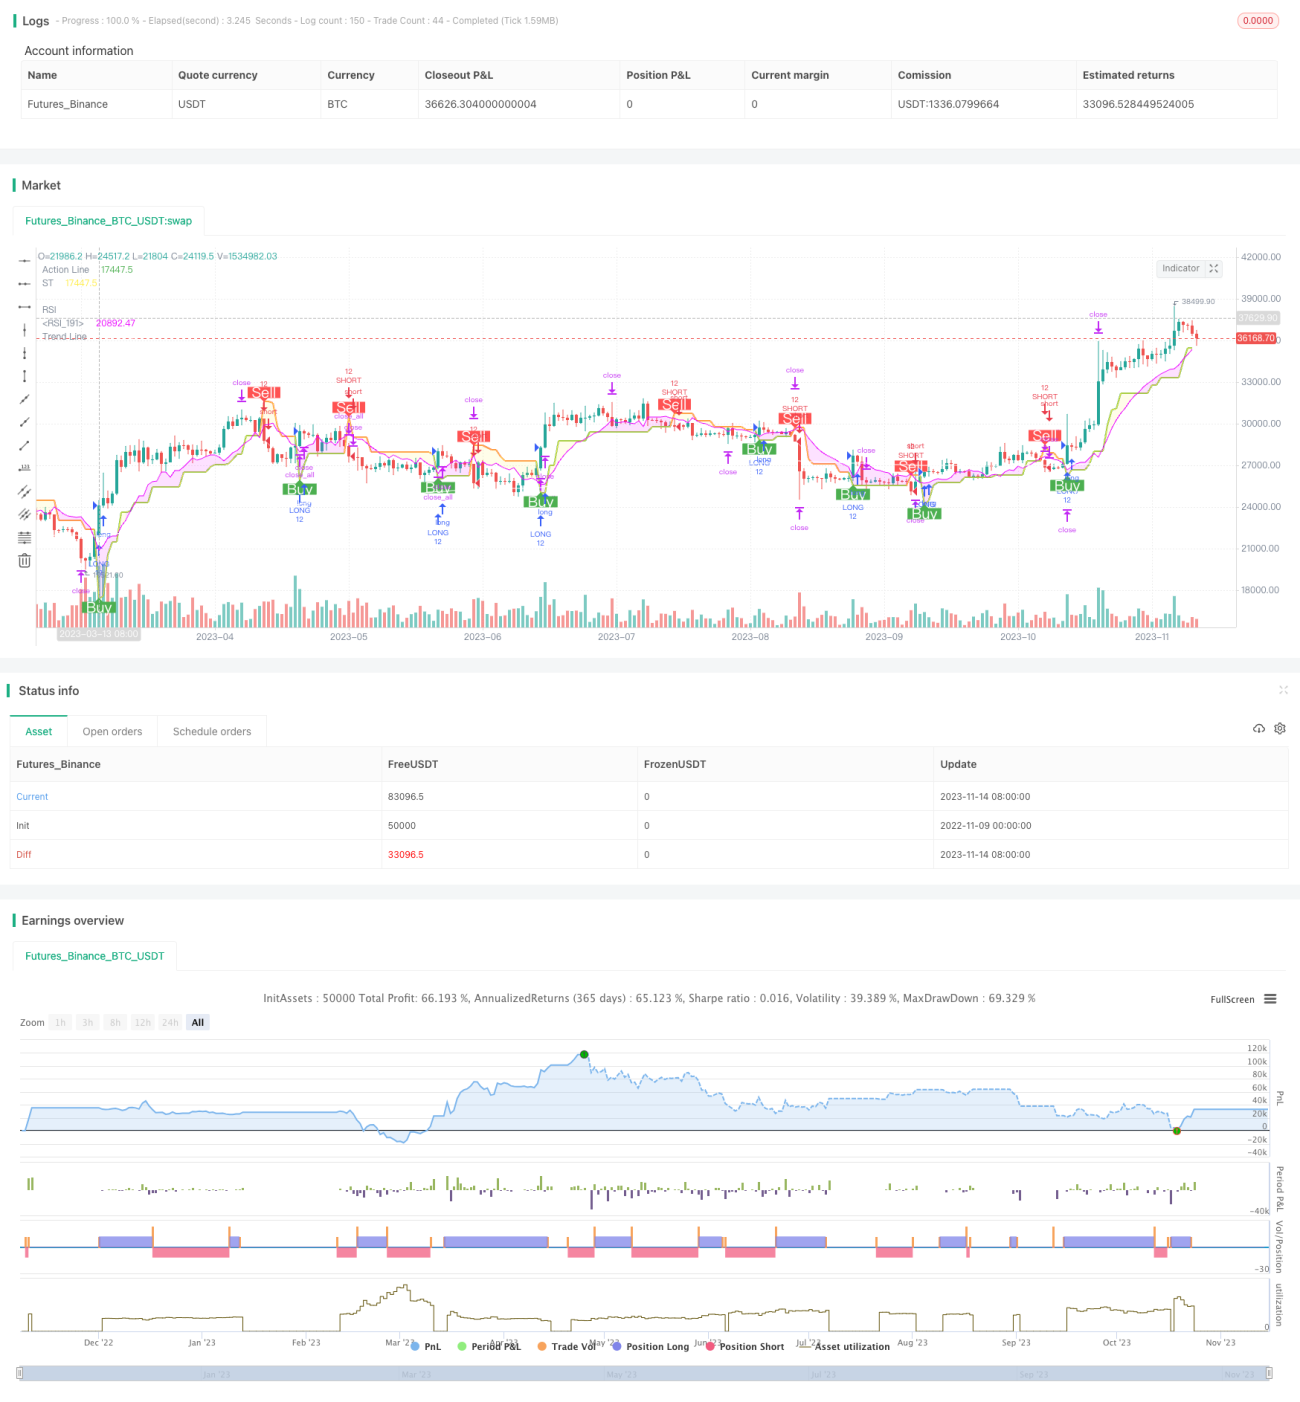
/*backtest
start: 2022-11-09 00:00:00
end: 2023-11-15 00:00:00
period: 1d
basePeriod: 1h
exchanges: [{"eid":"Futures_Binance","currency":"BTC_USDT"}]
*/

//@version=5
//
// ▒▒▒▒▒▒▒▒▒▒▒▒▒▒▒▒▒▒▒▒▒▒▒▒▒▒▒▒▒▒▒▒▒▒▒▒▒▒▒▒▒▒▒▒▒▒▒▒▒▒▒▒▒▒▒▒▒▒▒▒▒▒▒▒▒▒▒▒▒▒▒▒▒▒▒▒▒▒▒▒▒▒▒▒▒▒▒▒▒▒▒▒▒▒▒▒▒▒▒▒▒▒▒▒▒▒▒▒▒▒▒▒▒▒
// ------------------------------------------------------------------------------ 1