Estratégia de rompimento do desvio padrão da banda de Bollinger

1
Follow
1779
Followers
Visão geral
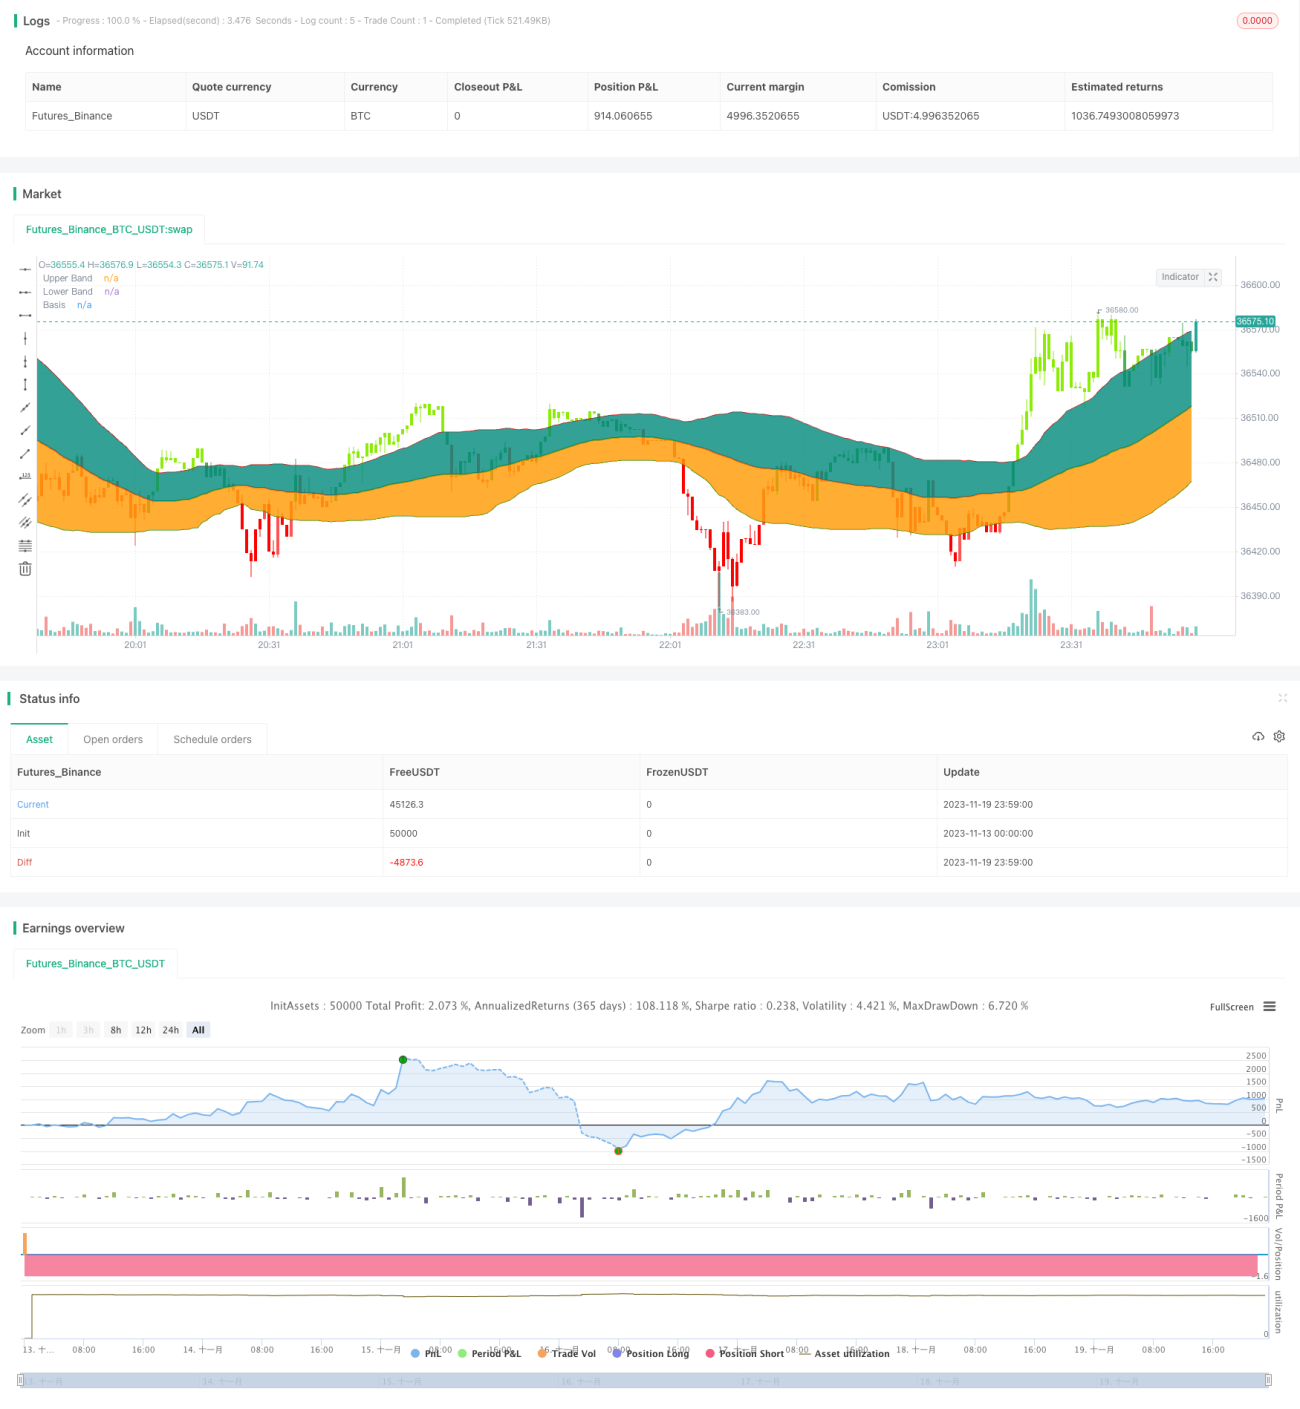
A estratégia é baseada no clássico indicador de Bollinger Bands, fazendo mais quando os preços fecharam para cima e fecharam para baixo quando os preços fecharam para baixo.
Princípio da estratégia
- A linha de referência é a média móvel simples de 55 dias.
- Os traços superiores e inferiores são os padrões de diferença abaixo da linha de referência.
- Quando os preços se fecham, um sinal de multiplicação é gerado.
- Quando o preço do fechamento quebra a trajetória de baixa, um sinal de curto prazo é gerado.
- O uso de padrão de diferença, em vez de padrão clássico, reduz o risco.
Análise de vantagens
- O uso de valores padrão em vez de valores fixos reduz o risco.
- A média móvel de 55 dias é um bom indicador da tendência a médio prazo.
- O fechamento foi mais rápido do que o início.
- É fácil determinar a direção da tendência através da análise de múltiplos períodos de tempo.
Análise de Riscos
- A situação é muito grave.
- É necessário ter em conta as consequências das taxas.
- O sinal de ruptura pode ser falso.
- Pode haver um ponto de perda.
Pode-se reduzir o risco através da configuração de stop loss, considerar as taxas de transação, ou adicionar filtros de indicadores.
Direção de otimização
- Optimizar os parâmetros da linha de referência para encontrar a melhor linha média.
- Os padrões de otimização variam muito entre si, para encontrar os melhores parâmetros.
- A adição de um indicador de valor agregado para um julgamento auxiliar.
- Adição de um mecanismo de suspensão.
Resumir
A lógica geral da estratégia é clara, o risco é ajustado através da largura de banda de diferença padrão, o fechamento da brecha evita a falsa brecha. No entanto, é necessário ter cuidado para evitar perdas de choque, que podem ser otimizadas por meio de stop loss, aumento de filtros e outras formas.
Source
Pine
Strategy parameters
Related strategies
Comment
All comments (0)
No data
- 1