Estratégia de negociação de momentum do sistema Dual Track

[trans]
Visão geral
Esta estratégia usa MACD e Stoch RSI para combinar os dois indicadores, para construir um sistema de negociação de duas vias, para permitir o acompanhamento de tendências e o julgamento de overbought e overbought. A estratégia constrói o indicador simultaneamente na linha do dia e na linha de 4 horas, para permitir julgamentos de múltiplos períodos de tempo, reduzindo a probabilidade de julgamento errado.
Princípio da estratégia
O portfólio de estratégias usa MACD e Stoch RSI, dois tipos diferentes de indicadores técnicos, para configurar. O MACD é um indicador de desvio, que julga a velocidade de mudança de preço; O Stoch RSI é um indicador de supercompra e supervenda, que julga a força relativa dos preços.
A estratégia começa com a construção dos indicadores MACD e Stoch RSI na linha diária e na linha de 4 horas, respectivamente, para julgar a tendência e o supermercado. Quando os indicadores dos dois períodos de tempo emitem sinais de compra / venda ao mesmo tempo, execute a compra / venda correspondente.
Concretamente, a construção do indicador MACD, a linha DIF e a linha DEA formam um forco de ouro para julgamento; a construção do indicador Stoch RSI, a linha K e a linha D formam um forco de ouro para julgamento. Quando os dois conjuntos de indicadores produzem um sinal de compra ao forcar simultaneamente e um sinal de venda ao forcar simultaneamente.
Assim, a estratégia utiliza um conjunto de indicadores de duas vias e de julgamentos de múltiplos quadros temporais para avaliar de forma abrangente a velocidade de mudança dos preços e a força relativa, o que ajuda a melhorar a precisão das decisões e obter melhores retornos.
Análise de vantagens
A estratégia tem as seguintes vantagens:
- Combinação de indicadores de dupla trajetória para um julgamento abrangente e maior precisão de decisão
- O uso de múltiplos períodos de tempo reduz a probabilidade de erros
- Utilizando o acompanhamento de tendências e o julgamento de supercompra e supervenda, considerando integralmente a velocidade de mudança de preços e a força relativa
- Parâmetros do indicador podem ser ajustados para diferentes variedades e condições de mercado
- Estrutura de código clara, fácil de entender e de expandir
Análise de Riscos
A estratégia também apresenta alguns riscos:
- Riscos sistêmicos que não podem ser totalmente evitados
- Parâmetros de indicadores mal definidos podem levar a transações frequentes ou a oportunidades perdidas
- A probabilidade de um indicador duplo emitir um sinal falso ao mesmo tempo existe, mas é menor do que um indicador único
- Não conseguem lidar com mudanças drásticas no mercado, como o grande evento do Black Swan
Resposta:
- Optimizar parâmetros, ajustar condições de compra e venda, reduzir erros de julgamento
- Combinação com mais indicadores para aumentar a base de julgamento
- Aumentar as estratégias de suspensão de perdas e controlar o risco de perdas únicas
Direção de otimização
A estratégia também pode ser melhorada em alguns aspectos:
- Adicionar mais indicadores para a combinação, construindo uma estratégia multi-indicador
- Aumentar os algoritmos de aprendizagem de máquina para a otimização de parâmetros dinâmicos
- Comparando os indicadores de sentimento com os da imprensa, para avaliar o mercado
- Aumentar as estratégias de stop loss e de suspensão e otimizar a gestão de fundos
- Expandir a variedade de negócios e buscar melhores oportunidades
Resumir
Esta estratégia usa uma combinação de indicadores de duas vias e julgamentos de múltiplos períodos de tempo para julgar a velocidade de mudança de preços e a força relativa de forma abrangente, para obter efetivamente a tendência do mercado e corrigir os erros de julgamento de um único indicador. Além disso, tem vantagens como a flexibilidade de ajuste de parâmetros, a facilidade de compreensão e expansão.
||
Overview
This strategy combines the MACD and Stoch RSI indicators to build a dual-rail trading system for trend tracking and oversold/overbought judgment. The strategy also builds indicators on the daily and 4-hour timeframes to make multi-timeframe judgments to reduce misjudgment probability.
Strategy Principle
The strategy combines the MACD and Stoch RSI indicators, which are different types of technical indicators, for configuration. MACD is a momentum indicator that judges price change velocity; Stoch RSI is an overbought/oversold indicator that judges relative price strength.
The strategy first constructs the MACD and Stoch RSI indicators on the daily and 4-hour timeframes respectively for trend and overbought/oversold judgments. When signals are triggered on both timeframes, corresponding buy/sell operations are performed.
Specifically, the MACD indicator is constructed with the DIF and DEA lines forming golden/dead crosses for judgment; the Stoch RSI indicator is constructed with the K and D lines forming golden/dead crosses for judgment. When both indicator pairs have golden crosses, buy signals are generated; when both have dead crosses, sell signals are generated.
Thus, by comprehensively applying the dual-indicator system and multi-timeframe judgments, the strategy judges price velocity and relative strength thoroughly, which helps improve decision accuracy and gain better returns.
Advantage Analysis
This strategy has the following advantages:
- Combining dual-indicator system for comprehensive judgment and higher decision accuracy
- Applying multi-timeframe to reduce misjudgment probability
- Adopting trend tracking and overbought/oversold judgment for consideration of both price velocity and relative strength
- Flexible indicator parameters adjustable for different products and market environments
- Clean code structure easy to understand and expand
Risk Analysis
There are also some risks with this strategy:
- There exist systemic market risks that cannot be fully avoided
- Inappropriate indicator parameter settings may lead to overtrading or missing opportunities
- Dual indicators may still give concurrent wrong signals, but less likely than single ones
- Unable to cope with drastic market changes like black swan events
Countermeasures:
- Optimize parameters and adjust trading conditions to reduce misjudgments
- Incorporate more indicators for combined judgments
- Add stop loss mechanisms to control single loss risk
Optimization Directions
This strategy can also be improved in the following aspects:
- Incorporate more indicators for multi-indicator strategies
- Add machine learning algorithms for dynamic parameter optimization
- Combine sentiment indicators, news etc. for more comprehensive market condition judgments
- Add stop loss, take profit strategies to optimize money management
- Expand to more trading products to discover better opportunities
Conclusion
By combined application of the dual-indicator system and multi-timeframe judgments, this strategy judges price velocity and relative strength thoroughly, which can effectively capture market trends and improve deficiencies of single indicators. It also has advantages like flexible parameter tuning, easy understanding and expansion. Further expansions by multi-indicator combination, dynamic parameter optimization, sentiment indicator incorporation etc. can help boost strategy performance.
[trans]
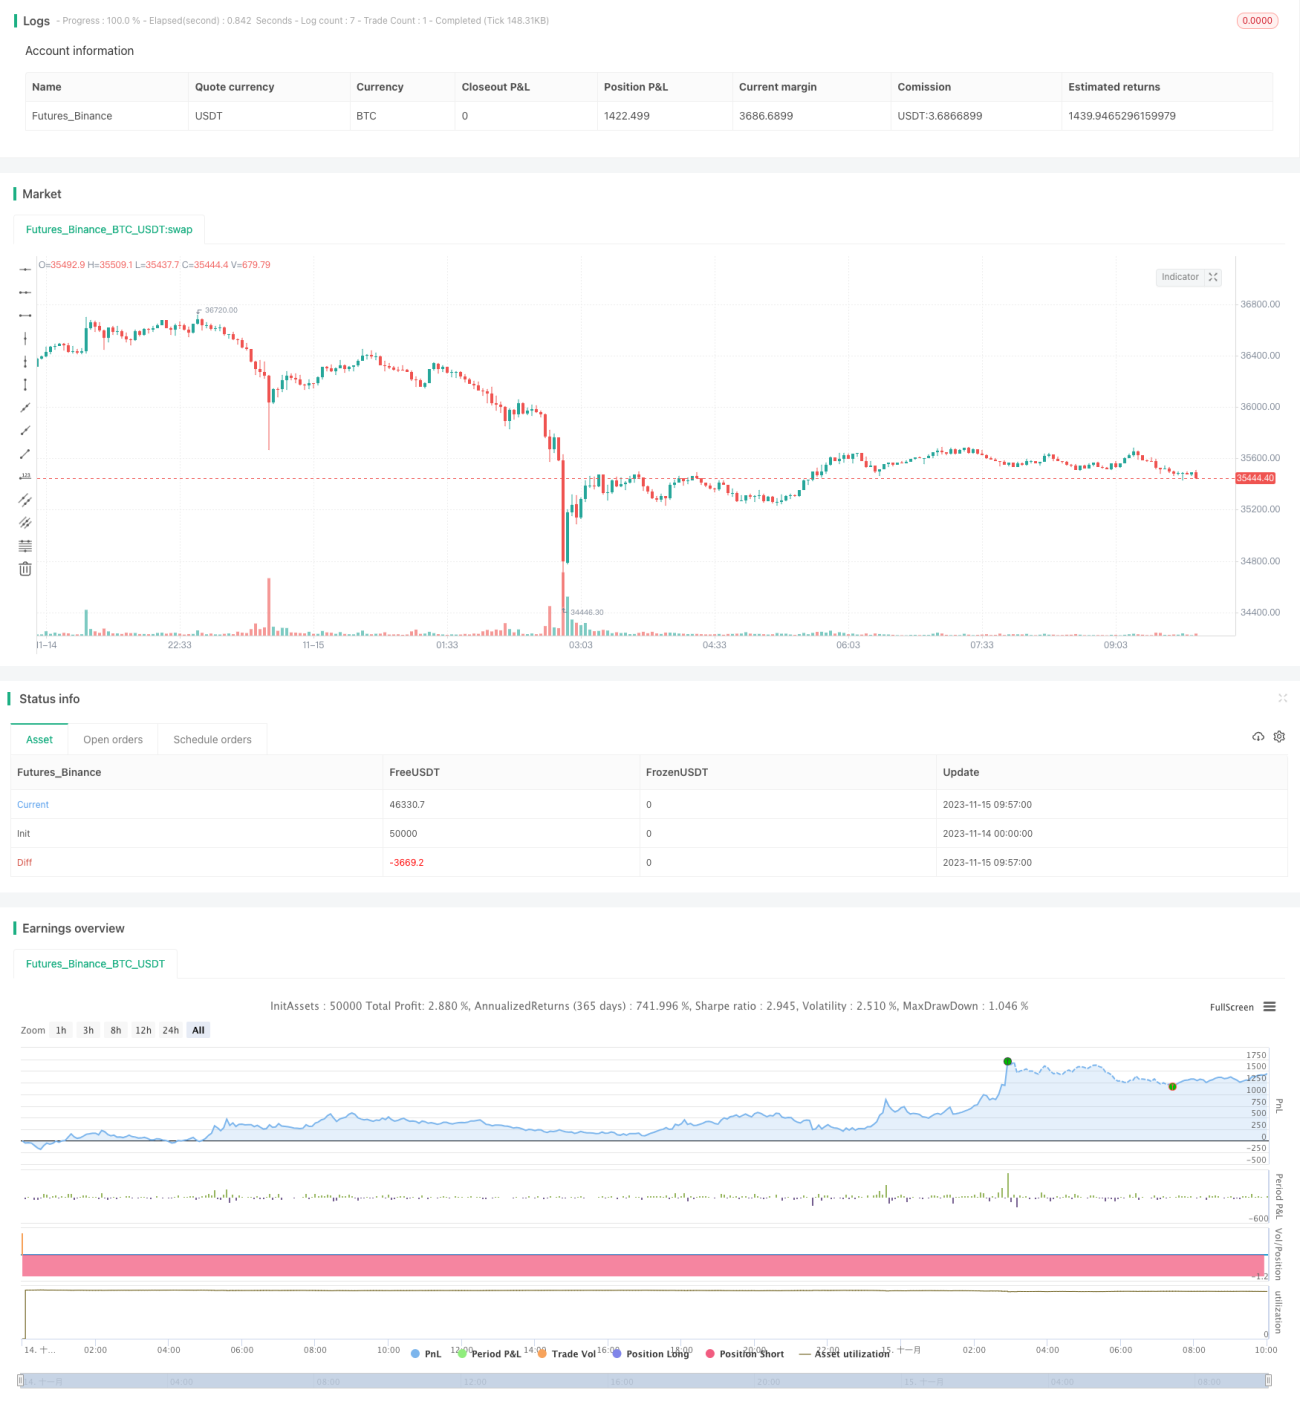
/*backtest
start: 2023-11-14 00:00:00
end: 2023-11-15 10:00:00
period: 3m
basePeriod: 1m
exchanges: [{"eid":"Futures_Binance","currency":"BTC_USDT"}]
*/

//@version=2
strategy(title='[RS]Khizon (UWTI) Strategy V0', shorttitle='K', overlay=false, pyramiding=0, initial_capital=100000, currency=currency.USD)
//  ||  Inputs:
macd_src = input(title='MACD Source:', defval=close)- 1