Estratégia de cruzamento de média móvel após tendência bidirecional

1
Follow
1779
Followers
Visão geral
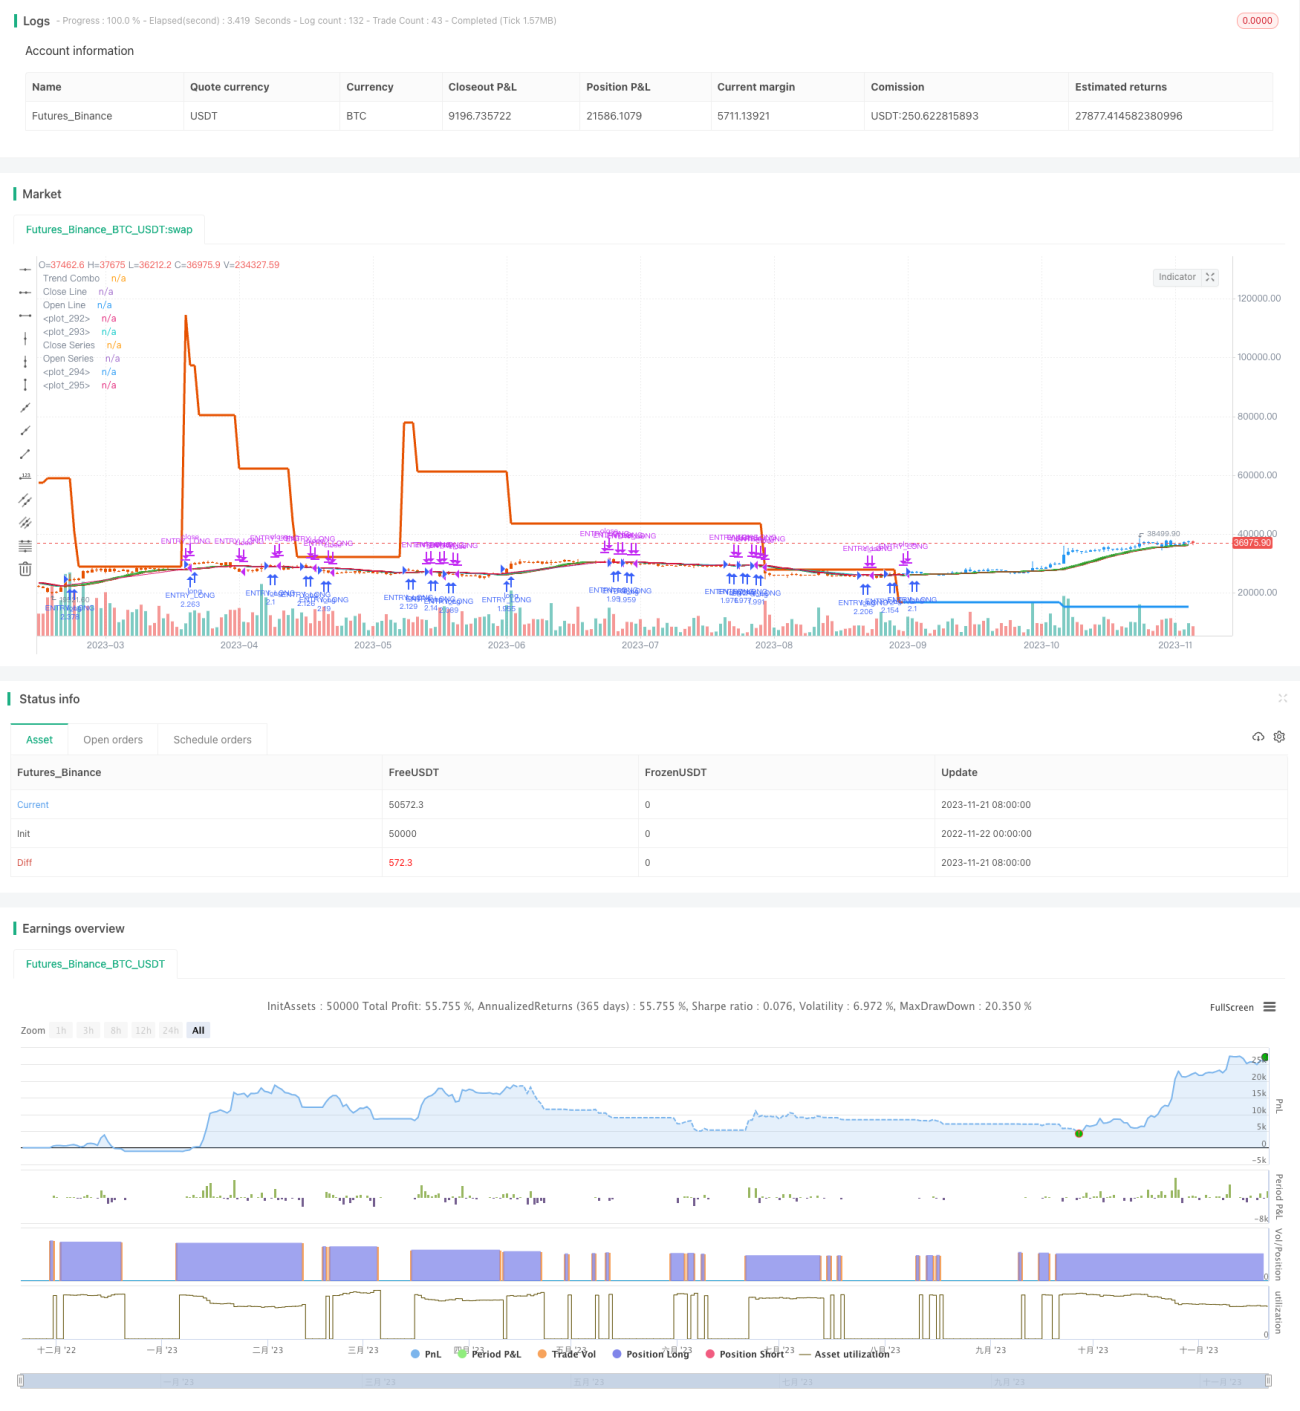
Esta estratégia permite uma estratégia de negociação cruzada que permite rastrear automaticamente a tendência dos preços através da computação de médias móveis planas bidirecionais, em combinação com indicadores de tendência. Esta estratégia visa rastrear tendências de longo prazo e obter maiores ganhos em tendências fortes.
Princípio da estratégia
- Calcule a média móvel bidirecional do preço, incluindo a média de abertura e a média de fechamento.
- Indicadores de tendência de preços com coeficientes relevantes e ATR.
- Combinando o indicador de tendência de preços com a média móvel bidirecional, obtém-se uma avaliação de tendência integrada.
- Faça mais quando a média de preço de abertura e a média de preço de fechamento ocorrem em um golden fork; leve quando ocorrem em um dead fork.
- Ao mesmo tempo, em combinação com o indicador de tendência, apenas quando o indicador de tendência também está em alta é que a posição pode ser aberta, apenas quando o indicador de tendência também está em baixa é que a posição pode ser aberta.
Vantagens estratégicas
- As médias móveis bidirecionais seguem a tendência dos preços de forma mais suave e estável.
- A combinação de indicadores de tendência permite uma melhor avaliação da direção da tendência e evita erros de negociação.
- O uso de forcas de ouro e forcas de morte para determinar o momento específico da transação é mais claro.
- A suavidade de escolha pode ser ajustada com parâmetros para se adaptar a um ambiente de mercado maior.
- Os indicadores podem ser verificados mutuamente para reduzir os falsos sinais.
Risco estratégico
- O risco de perder uma reversão no ponto de viragem da tendência pode ser reduzido ajustando o ciclo da média móvel.
- As médias móveis bidirecionais, por si só, são muito atrasadas e precisam ser verificadas com os indicadores de tendência.
- O ciclo de média móvel impróprio pode levar a uma frequência de negociação excessiva ou a um bom tempo de negociação perdido.
- Os parâmetros de otimização precisam ser testados repetidamente para se adaptar a diferentes ciclos e condições de mercado.
Direção de otimização da estratégia
- Teste mais tipos de médias móveis.
- Tente outros tipos de indicadores de tendências.
- Parâmetros de otimização de médias móveis e indicadores de tendência.
- Tente combiná-los com outros indicadores, como o índice de volatilidade.
- Aumentar as estratégias de stop loss.
Resumir
Esta estratégia prevê tendências de preços em várias dimensões e pode rastrear as tendências de linha longa de forma estável após a otimização dos parâmetros. Mas é necessário tomar cuidado para evitar otimização excessiva e ajuste de medida. Em geral, a estratégia permite o rastreamento de tendências de linha longa com menor risco e merece mais pesquisa e aplicação.
Source
Pine
Strategy parameters
Related strategies
Comment
All comments (0)
No data
- 1