Estratégia quantitativa do gráfico de nuvem Ichimoku
Visão geral
Trata-se de uma estratégia de quantificação do Ichimoku Cloud. A estratégia determina a direção da tendência através do indicador de Ichimoku, em conjunto com a forma de K-line, a média móvel e o indicador Stochastic RSI filtram os sinais e escolhem os melhores pontos de entrada quando a tendência sobe.
Princípio da estratégia
Os principais critérios da estratégia são:
- Ichimoku cruza a linha de liderança 1 na linha de liderança 2, indicando uma maior mudança de tendência
- A linha K atravessa a linha líder 1 no preço de fechamento, conforme a condição de acompanhar a tendência
- A linha K é a linha Y, tendência para cima
- Quando a média móvel é ativada, é necessário que a linha rápida atravesse a linha lenta.
- Ativar Stochastic RSI requer que a linha K atravesse a linha D
Quando as condições acima são simultaneamente preenchidas, a estratégia abre uma posição a mais; quando o preço cai abaixo da linha de liderança 1, a estratégia elimina a posição.
A estratégia utiliza o gráfico da nuvem de Ichimoku para determinar a direção da tendência principal e, em combinação com os sinais de filtragem de indicadores auxiliares, escolhe os melhores pontos de entrada quando a tendência sobe.
Vantagens estratégicas
- O retrospecto mostra uma alta taxa de precisão com o mapa das nuvens de Ichimoku para determinar as principais tendências.
- Combinação de vários indicadores auxiliares para filtrar pontos de entrada, aumentando significativamente a taxa de ganho
- A única estratégia é usar moedas que são julgadas como multi-cabeças.
- Optimização de parâmetros de espaço grande, pode ajustar parâmetros indicadores para otimizar ainda mais
Risco estratégico
- A probabilidade de falhar no cálculo do mapa das nuvens de Ichimoku pode ser um erro na direção da tendência
- Os pontos de suspensão podem ser ultrapassados em caso de desaceleração, resultando em perdas maiores.
- Moedas que são projetadas para movimentos múltiplos e não são adequadas para sinais de tendência oculta
- A configuração inadequada dos parâmetros pode levar a uma entrada excessiva ou excessiva
Resposta:
- Melhorar a precisão do julgamento, combinado com a tendência de mais indicadores
- Estabelecer um ponto de parada razoável e controlar rigorosamente as perdas individuais
- Seleção de estratégias para diferentes moedas
- Teste e otimize os parâmetros para tornar a estratégia mais estável
Direção de otimização da estratégia
- Optimizar a configuração dos parâmetros dos indicadores auxiliares para aumentar ainda mais a estabilidade da estratégia
- Aumentar os mecanismos de suspensão de perdas, como o rastreamento de perdas, a suspensão de perdas de médias móveis de índices, etc.
- Aumentar o gerenciamento de posições, como posições fixas e médias de posições
- Optimização de ajustes de parâmetros para moedas específicas
Resumir
A estratégia de quantificação do Ichimoku Cloud Graph faz uma estratégia única de apenas vários cabeças, determinando a direção da tendência, alcançando uma alta taxa de vitória e um risco controlável. A vantagem da estratégia é evidente e o efeito é notável em situações de vários cabeças. O próximo passo pode ser melhorado em termos de otimização de indicadores, mecanismo de parada de perdas e gerenciamento de posição, etc., para tornar a estratégia mais perfeita e estável.
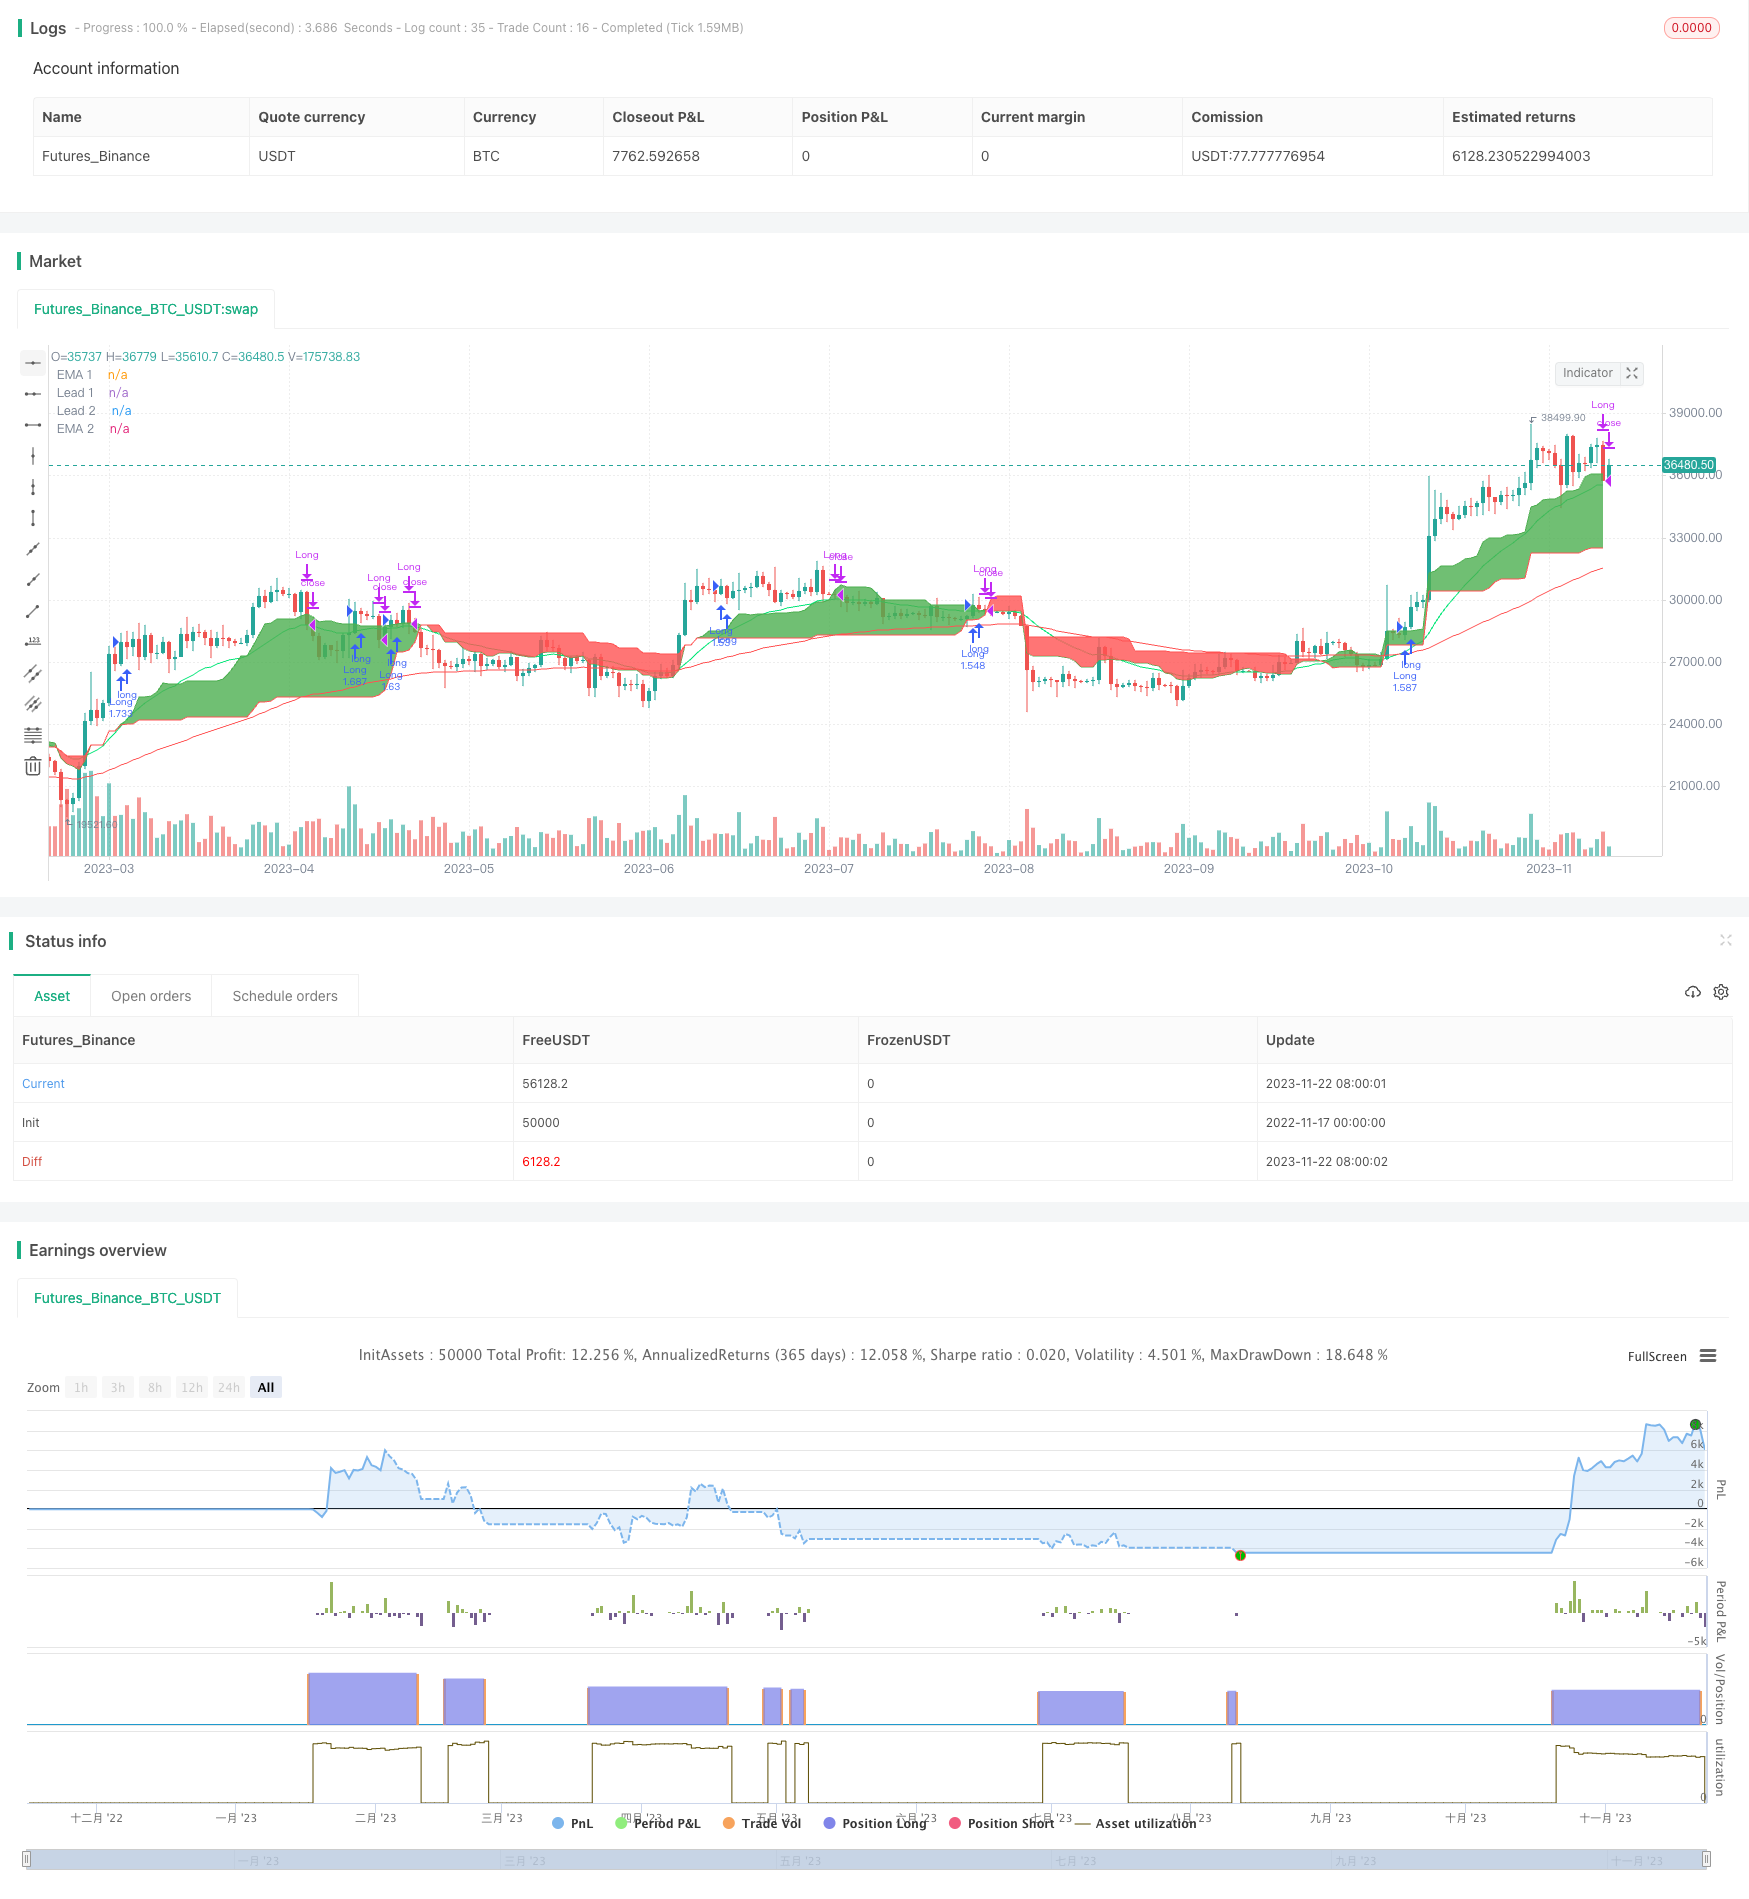
/*backtest
start: 2022-11-17 00:00:00
end: 2023-11-23 00:00:00
period: 1d
basePeriod: 1h
exchanges: [{"eid":"Futures_Binance","currency":"BTC_USDT"}]
*/

//@version=4

strategy(title="Ichimoku only Long Strategy", shorttitle="Ichimoku only Long", overlay = true, pyramiding = 0, calc_on_order_fills = false, commission_type =  strategy.commission.percent, commission_value = 0, default_qty_type = strategy.percent_of_equity, default_qty_value = 100, initial_capital=10000, currency=currency.USD)

// Time Range
FromMonth=input(defval=1,title="FromMonth",minval=1,maxval=12)
FromDay=input(defval=1,title="FromDay",minval=1,maxval=31)
FromYear=input(defval=2017,title="FromYear",minval=2017)
ToMonth=input(defval=1,title="ToMonth",minval=1,maxval=12)
ToDay=input(defval=1,title="ToDay",minval=1,maxval=31)
ToYear=input(defval=9999,title="ToYear",minval=2017)
start=timestamp(FromYear,FromMonth,FromDay,00,00)
finish=timestamp(ToYear,ToMonth,ToDay,23,59)
window()=>true
// See if this bar's time happened on/after start date
afterStartDate = time >= start and time<=finish?true:false

//Enable RSI
enableema = input(true, title="Enable EMA?")
enablestochrsi = input(false, title="Enable Stochastik RSI?")

//EMA
emasrc = close,
len1 = input(24, minval=1, title="EMA 1")
len2 = input(90, minval=1, title="EMA 2")

ema1 = ema(emasrc, len1)
ema2 = ema(emasrc, len2)

col1 = color.lime
col2 = color.red

//EMA Plots
plot(ema1, title="EMA 1", linewidth=1, color=col1)
plot(ema2, title="EMA 2", linewidth=1, color=col2)

//STOCH RSI
smoothK = input(3, minval=1, title="RSI K Line")
smoothD = input(3, minval=1, title="RSI D Line")
lengthRSI = input(14, minval=1, title="RSI Length")
lengthStoch = input(14, minval=1, title="Stochastik Length")
src = input(close, title="RSI Source")

rsi1 = rsi(src, lengthRSI)
k = sma(stoch(rsi1, rsi1, rsi1, lengthStoch), smoothK)
d = sma(k, smoothD)

//Ichimoku
conversionPeriods = input(9, minval=1, title="Ichi Conversion Line Length")
basePeriods = input(26, minval=1, title="Ichi Base Line Length")
laggingSpan2Periods = input(52, minval=1, title="Ichi Lagging Span 2 Length")
displacement = input(1, minval=0, title="Ichi Displacement")
donchian(len) => avg(lowest(len), highest(len))
conversionLine = donchian(conversionPeriods)
baseLine = donchian(basePeriods)
leadLine1 = avg(conversionLine, baseLine)
leadLine2 = donchian(laggingSpan2Periods)
p1 = plot(leadLine1, offset = displacement - 1, color=color.green,
	 title="Lead 1")
p2 = plot(leadLine2, offset = displacement - 1, color=color.red,
	 title="Lead 2")
fill(p1, p2, color = leadLine1 > leadLine2 ? color.green : color.red)


//Long Condition
crossup = k[0] > d[0] and k[1] <= d[1]
ichigreenabovered = leadLine1 > leadLine2
ichimokulong = close > leadLine1
greencandle =  close > open
redcandle = close < open
emacond = ema1 > ema2
longcondition = ichigreenabovered and ichimokulong and greencandle

//Exit Condition
ichimokuexit = close < leadLine1

exitcondition = ichimokuexit and redcandle

//Entrys

if (enablestochrsi == false) and (enableema == false) and (longcondition) and (afterStartDate) and (strategy.opentrades < 1)
    strategy.entry("Long", strategy.long)

if (enablestochrsi == true) and (enableema == false) and (longcondition) and (crossup) and (afterStartDate) and (strategy.opentrades < 1)
    strategy.entry("Long", strategy.long)

if (enableema == true) and (enablestochrsi == false) and (longcondition) and (emacond) and (afterStartDate) and (strategy.opentrades < 1)
    strategy.entry("Long", strategy.long)

if (enableema == true) and (enablestochrsi == true) and (longcondition) and (emacond) and (crossup) and (afterStartDate) and (strategy.opentrades < 1)
    strategy.entry("Long", strategy.long)


//Exits
if (afterStartDate)
    strategy.close(id = "Long", when = exitcondition)