Média móvel três mosqueteiros estratégia de negociação quantitativa
Descrição: Esta estratégia é uma estratégia típica de análise técnica, que utiliza vários indicadores de linha média comuns, como a EMA, bem como indicadores auxiliares como RSI, MACD e PSR, para formar regras de entrada e parada de perda por meio de uma combinação de diferentes configurações de linha média periódicas e sinais de indicadores.
Princípio da estratégia: O núcleo da estratégia é a média de 5, 9, 21 dias. Quando a média de curto período é superior à média de longo período, e a média de curto período é inferior à média de longo período. Além disso, a combinação do indicador RSI determina o excesso de venda, o MACD determina a tendência e o indicador PSR identifica a resistência de suporte para o comércio de combinação.
Análise de vantagens estratégicas:
- O indicador de linha média é claro e intuitivo, facilitando a determinação da direção da tendência.
- O RSI é eficaz na identificação de tendências de sobrecompra e sobrevenda, o MACD determina tendências de longo e curto prazo, o PSR busca preços-chave e combinações de indicadores complementares.
- Há uma grande flexibilidade na configuração de regras e parâmetros de entrada.
- Há uma ampla gama de indicadores e parâmetros que podem ser otimizados e adaptados ao mercado.
Análise de Riscos:
- A operação de ciclo curto é difícil de entender a grande tendência e corre o risco de perder a reversão.
- A configuração inadequada dos parâmetros pode causar muitos falsos sinais ou falhas de sinal.
- Os indicadores puramente técnicos são facilmente usados por agências de arbitragem e causam perdas.
- A maioria das pessoas que vivem em áreas de risco são vulneráveis a grandes movimentos sísmicos.
Como reagir:
- Aproveite a tendência da linha longa e evite operações de linha curta de contra-corrida.
- Optimizar a combinação de parâmetros, definir o stop loss, controlar o risco.
- Atenção para a possibilidade de um retrocesso de alta e um rebote de baixa.
Otimização:
- Ajustar os parâmetros da linha média para testar a melhor combinação.
- Adicionar outros indicadores auxiliares para filtrar sinais.
- Aumentar a probabilidade de julgamento de indicadores de aprendizagem de máquina.
- A precisão do sinal foi aumentada com a variação do volume de transações.
- Aumentar as estratégias de suspensão de perdas para evitar a expansão das perdas.
Resumo: A estratégia integra vários sinais de indicadores auxiliares, aproveitando os benefícios dos indicadores de linha média, para explorar oportunidades de compra e venda de curto prazo. A otimização de parâmetros e a combinação de indicadores podem aumentar continuamente a eficácia da estratégia, mas é necessário controlar moderadamente a frequência e o risco das operações para evitar que um único prejuízo tenha um impacto significativo no lucro geral.
||
Overview: This strategy is a typical technical analysis strategy that utilizes several common moving average indicators like EMA and auxiliary indicators like RSI, MACD, PSR to form entry and stop loss rules for finding low buy high sell opportunities.
Principle: The core of this strategy is the 5, 9, 21 day moving averages. When the short period MA crosses over the long period one, it signals an uptrend; when the short period MA crosses below the long period one, it signals a downtrend. In addition, RSI is used to determine overbought and oversold levels, MACD to judge the trend, PSR to identify support and resistance for combo trading. The background color shows market sentiment to assist trend judgment. The parameters are customizable for configuring entry rules.
Advantages:
- MA indicators give clear trend direction.
- RSI effectively spots overbought/oversold levels, MACD judges short-long trend, PSR finds key price levels. The indicators are complementary.
- Flexible entry rules and parameter settings.
- Many optimizable indicators and parameter combinations adaptable to varying market conditions.
Risks:
- Short-term operations may fail to capture major trend and miss reversals.
- Improper parameter configuration can lead to too many false signals or missing good signals.
- Pure technical indicators are susceptible to manipulation by arbitrageurs causing losses.
- Prone to being stopped out in high volatile markets.
Solutions:
- Capture mid-long term trend appropriately to avoid trading against major trend.
- Optimize parameters, use stop loss to control risks.
- Watch out the possibilities of pullback from highs and bounce from lows.
Optimization:
- Fine tune MA parameters for best combo.
- Add more indicators to filter signals.
- Increase machine learning metrics for probability estimate.
- Combine volume changes to enhance signal accuracy.
- Add stop loss to restrict loss expansion.
Summary: This strategy integrates multiple auxiliary signals, leverages the strength of MA indicators to identify short-term low buy high sell chances. Parameters and indicators combinations may be optimized continuously to improve strategy efficacy, but operation frequency and risks should be moderated to prevent oversized single trade loss from eroding overall profitability.
[/trans]
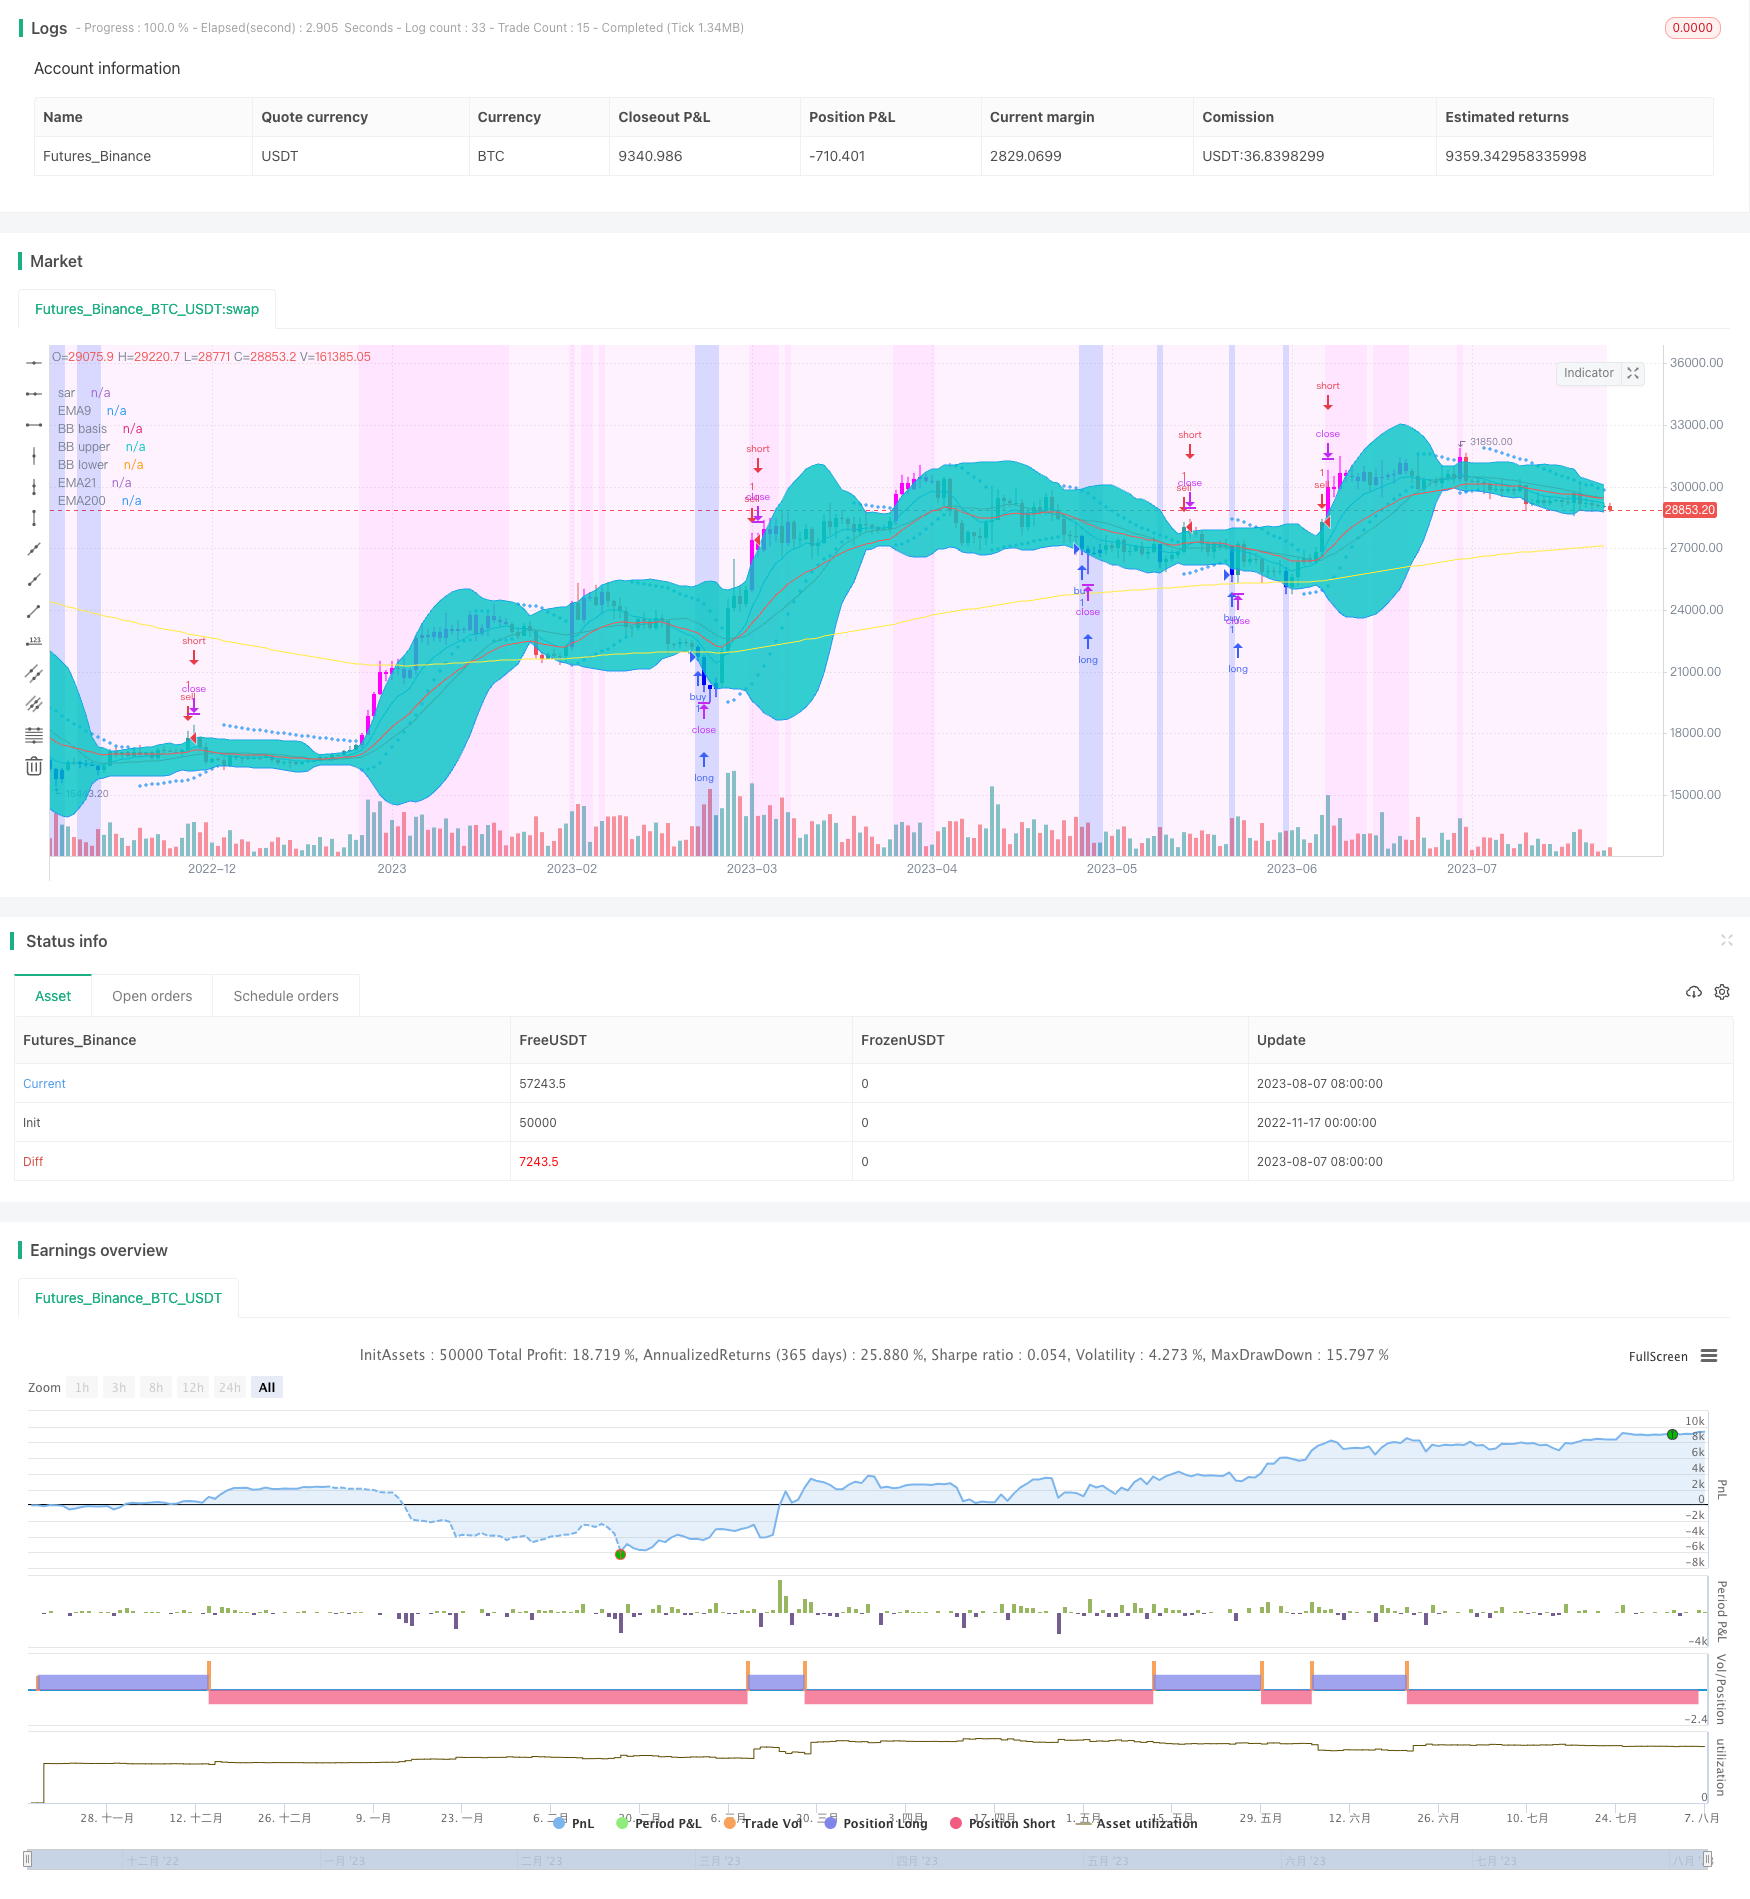
/*backtest
start: 2022-11-17 00:00:00
end: 2023-08-08 00:00:00
period: 1d
basePeriod: 1h
exchanges: [{"eid":"Futures_Binance","currency":"BTC_USDT"}]
*/

//@version=3
strategy("f.society v7", title="f.society v7", overlay=true)
//@Author: rick#1414
// -----------------------------------------------------
// f.society : Pone 3EMA: 5, 9, 21, 50, 100, 200, SAR,
// velas azules en sobreventa y velas moradas sobre compra
// SAR 0.02, 0.02, 0.2 , Bandas de Bollinger
// estrategia de compra y venta con rsi, macd o psr
// color de fondo: ema, rsi (color azul sobreventa 35, 25 (mas intenso))
// -----------------------------------------------------
// Como agregar a Trading view:
// 1 Cerrar todos los otros indicadores antes de añadirlo
// 2. Ir a la página de inicio TradingView.com
// 3. En la parte inferior, haga clic en Editor Pine // ver imagen: // https://cdn.discordapp.com/attachments/407267549047422976/407393815112974336/unknown.png
// 4. borrar todo el texo y reemplazar con todo el contenido de este archivo
// 5. Pulse el botón "Añadir a trazar" (Add to graph)
// -----------------------------------------------------
// revisar opciones de on y off segun indicadores deseados
// https://cdn.discordapp.com/attachments/405885820114042883/412115277883506700/unknown.png
// se puede cambiar la estrategia desde este menu desplegable para señales buy/sell

// Options
estrategia = input(defval="rsi", title = "Strategy", options=["ema","rsi","macd","psr","off","BB","ema5"])
in_bkcolor = input(defval="rsi", title = "background color", options=["ema","rsi","macd","psr","off","exchange","BB","ema5"])
e5 = input(title="Show ema5?", type=bool, defval=false)
e9 = input(title="Show ema9?", type=bool, defval=true)
e21 = input(title="Show ema21?", type=bool, defval=true)
e50 = input(title="Show ema50?", type=bool, defval=false)
e100 = input(title="Show ema100?", type=bool, defval=false)
e200 = input(title="Show ema200", type=bool, defval=true)
in_rsi = input(title="Color oversold and overbought bars?", type=bool, defval=true)
in_sar = input(title="Show Parabolic Sar", type=bool, defval=true)
in_bb = input(title="Show Bollinger Bands?", type=bool, defval=true)
sd = input(false, title="Show Daily Pivots?")
linew = input(1, title="linewidth", minval=0)
sarw = input(1, title="sar points width", minval=0)
ovs = input(40, title="oversold rsi", minval=0)
ovb = input(65, title="overbought rsi", minval=0)


//pf = input(false,title="Show Filtered Pivots")
pf=false

// 3 ema
src = close // input(close, title="Source")
//len9 = input(9, minval=1, title="ema9 Length")
//len21 = input(21, minval=1, title="ema21 Length")
//len200 = input(200, minval=1, title="ema200 Length")
len5=5
len9=9
len21=21
len50=50
len100=100
len200=200
ema5 = ema(src, len5)
ema9 = ema(src, len9)
ema21 = ema(src, len21)
ema50= ema(src, len50)
ema100 = ema(src, len100)
ema200 = ema(src, len200)
plot(e5? ema5 : na, title="EMA5", linewidth=linew, color=purple)
plot(e9? ema9 : na, title="EMA9", linewidth=linew, color=blue)
plot(e21? ema21 : na, title="EMA21", linewidth=linew, color=red)
plot(e50? ema50 : na, title="EMA50", linewidth=linew, color=green)
plot(e100? ema100 : na, title="EMA100", linewidth=linew, color=lime)
plot(e200? ema200 : na, title="EMA200", linewidth=linew, color=yellow)

// RSI Color
//lenR = input(14, minval=1, title="RSI Length")
lenR=14
//up = rma(max(change(src), 0), lenR)
//down = rma(-min(change(src), 0), lenR)
//vrsi = down == 0 ? 100 : up == 0 ? 0 : 100 - (100 / (1 + up / down))
vrsi=rsi(close,lenR)
//plot(vrsi,title="vrsi")
oversold = vrsi < ovs
overbought = vrsi > ovb
barcolor(in_rsi? oversold? #0000FF : overbought? #ff00ff:na : na)

// SAR
plot(in_sar? sar(0.02, 0.02, 0.2): na, style=cross, linewidth=sarw, color=blue, title="sar")

// BB
//length = input(20, title="Bollinger length", minval=1)
length=20
//mult = input(2.0, title="Bollinger stdDev", minval=0.001, maxval=50)
mult=2.0
basis = sma(src, length)
dev = mult * stdev(src, length)
upper = basis + dev
lower = basis - dev
plot(in_bb? basis :na, color=red, linewidth=linew, title="BB basis")
p1 = plot(in_bb? upper :na, color=blue, linewidth=linew, title="BB upper")
p2 = plot(in_bb? lower :na, color=blue, linewidth=linew, title="BB lower")
fill(p1, p2)

//background
bgcolor(in_bkcolor=="exchange"? #0000FF40 : in_bkcolor=="rsi"? vrsi < (ovs-15) ? #0000FF50  : vrsi < ovs ? #0000FF30 :( vrsi < ovb ? #ff00ff10 : #ff00ff20): in_bkcolor=="ema"?(ema9>ema21?#ff00ff10  : #0000FF20):in_bkcolor=="BB"?(lower>close?#ff00ff10 : close>upper?#0000FF20:#ff00ff10): in_bkcolor=="ema5"?(ema5>ema21?#ff00ff10  : #0000FF20):na)


// Strategy
if estrategia == "ema"
    strategy.entry("buy", true, 1, when= crossover(ema9,ema21) ),
    strategy.entry("sell", false, 1, when = crossover(ema21,ema9))
else
    if estrategia =="rsi"
        strategy.entry("buy", true, 1, when= vrsi <ovs),
        strategy.entry("sell", false, 1, when = vrsi > ovb or crossover(close,upper))
    else
        if estrategia =="macd"
            [macdLine, signalLine, histLine] = macd(close, 12, 26, 9),
            //bgcolor(macdLine > signalLine ? #98c8ff : #ff8b94),
            strategy.entry("buy", true, 1, when= macdLine>=signalLine ),
            strategy.entry("sell", false, 1, when = macdLine<signalLine)
        else
            if estrategia=="psr"
                leftBars = 4 //input(4)
                rightBars = 2 //input(2)
                swh = pivothigh(leftBars, rightBars)
                swl = pivotlow(leftBars, rightBars)
                swh_cond = not na(swh)
                hprice = 0.0
                hprice := swh_cond ? swh : hprice[1]
                le = false
                le := swh_cond ? true : (le[1] and high > hprice ? false : le[1])
                if (le)
                    strategy.entry("buy", strategy.long, comment="buy", stop=hprice + syminfo.mintick)
                swl_cond = not na(swl)
                lprice = 0.0
                lprice := swl_cond ? swl : lprice[1]
                se = false
                se := swl_cond ? true : (se[1] and low < lprice ? false : se[1])
                if (se)
                    strategy.entry("sell", strategy.short, comment="sell", stop=lprice - syminfo.mintick)
            else
                if estrategia=="BB"
                    strategy.entry("buy", true, 1, when= crossover(lower,close) ),
                    strategy.entry("sell", false, 1, when = crossover(close,upper))
                else
                    if estrategia=="ema5"
                        strategy.entry("buy", true, 1, when= crossover(ema5,ema21) ),
                        strategy.entry("sell", false, 1, when = crossover(ema21,ema5))


// pivots

// Classic Pivot
pivot = (high + low + close ) / 3.0
// Filter Cr
bull= pivot > (pivot + pivot[1]) / 2 + .0025
bear= pivot < (pivot + pivot[1]) / 2 - .0025
// Classic Pivots
r1 = pf and bear ? pivot + (pivot - low) : pf and bull ? pivot + (high - low) : pivot + (pivot - low)
s1 = pf and bull ? pivot - (high - pivot) : pf and bear ? pivot - (high - low) : pivot - (high - pivot)
r2 = pf ? na : pivot + (high - low)
s2 = pf ? na : pivot - (high - low)
//Pivot Average Calculation
smaP = sma(pivot, 3)
//Daily Pivots
dtime_pivot = request.security(syminfo.tickerid, 'D', pivot[1])
dtime_pivotAvg = request.security(syminfo.tickerid, 'D', smaP[1])
dtime_r1 = request.security(syminfo.tickerid, 'D', r1[1])
dtime_s1 = request.security(syminfo.tickerid, 'D', s1[1])
dtime_r2 = request.security(syminfo.tickerid, 'D', r2[1])
dtime_s2 = request.security(syminfo.tickerid, 'D', s2[1])
offs_daily = 0
plot(sd and dtime_pivot ? dtime_pivot : na, title="Daily Pivot",style=line, color=fuchsia,linewidth=linew)
plot(sd and dtime_r1 ? dtime_r1 : na, title="Daily R1",style=line, color=#DC143C,linewidth=linew)
plot(sd and dtime_s1 ? dtime_s1 : na, title="Daily S1",style=line, color=lime,linewidth=linew)
plot(sd and dtime_r2 ? dtime_r2 : na, title="Daily R2",style=line, color=maroon,linewidth=linew)
plot(sd and dtime_s2 ? dtime_s2 : na, title="Daily S2",style=line, color=#228B22,linewidth=linew)


// References:
// get number of bars since last green bar
//plot(barssince(close >= open), linewidth=3, color=blue)
//bgcolor(close < open ? #ff8b94   : #98c8ff , transp=10)
//http://www.color-hex.com/
//   #98c8ff    light blue
//    #ff8b94   red   #b21c0e
//       #7d1d90    purple
//    #0029ff blue
//    #fffa86   yellow