
Esta estratégia baseia-se no indicador de fluctuância média real (ATR) para projetar uma linha de stop loss móvel e uma linha de reversão. Ela segue a trailing stop loss, ou seja, ajusta a linha de stop loss de acordo com a mudança de preço.
A estratégia usa o indicador ATR para calcular a linha de parada. A fórmula específica é a seguinte:
atr = multplierFactor * atr(barsBack)
longStop = hl2 - atr
shortStop = hl2 + atr
O MultiplierFactor é o coeficiente de amplificação do ATR, e o barBack é o número de ciclos do ATR. Quanto maior o ATR, maior é a flutuação do mercado.
Calcula-se a linha de perda de posição longa longStop e a linha de perda de posição curta shortStop com base no valor ATR. Quando o preço ultrapassa essas duas linhas, é emitido um sinal de negociação.
Além disso, a estratégia introduziu uma variável de direção para determinar a direção da tendência:
direction = 1
direction := nz(direction[1], direction)
direction := direction == -1 and close > shortStopPrev ? 1 : direction == 1 and close < longStopPrev ? -1 : direction
Se a direção for 1 significa que está em uma tendência multi-cabeça, e se a direção for -1 significa que está em uma tendência a cavalo.
De acordo com o valor da variável de direção, uma linha de perda de diferentes cores é desenhada:
if (direction == 1)
valueToPlot := longStop
colorToPlot := color.green
else
valueToPlot := shortStop
colorToPlot := color.red
Isso permite ver claramente a direção da tendência atual e a posição da linha de parada.
O ponto crucial da estratégia é a introdução de um mecanismo de tracking de stop loss, que pode ajustar a linha de stop loss em tempo real de acordo com a operação do preço.
A lógica é a seguinte:
strategyPercentege = (close - updatedEntryPrice) / updatedEntryPrice * 100.00
rideUpStopLoss = hasOpenTrade() and strategyPercentege > 1
if (rideUpStopLoss)
stopLossPercent := stopLossPercent + strategyPercentege - 1.0
newStopLossPrice = updatedEntryPrice + (updatedEntryPrice * stopLossPercent) / 100
stopLossPrice := max(stopLossPrice, newStopLossPrice)
updatedEntryPrice := stopLossPrice
Se o preço aumentar mais de 1% em relação ao preço de entrada, siga para cima para ajustar a linha de stop loss. A amplitude de ajuste é superior a 1%.
Isso permite que se consigam mais lucros e menos perdas.
Em comparação com a tradicional estratégia de stop loss móvel, a maior vantagem desta estratégia é que a linha de stop loss pode ser ajustada dinamicamente de acordo com a situação do mercado. As vantagens específicas são as seguintes:
O mecanismo de rastreamento de stop loss permite que a linha de stop loss se mova continuamente em direção aos lucros, o que permite que os lucros sejam mais altos se o mercado continuar forte.
A linha de perda móvel fixa pode ser facilmente ignorada quando a tendência do mercado muda. A linha de perda da estratégia é baseada na volatilidade do mercado e pode ser razoavelmente acompanhada pelas mudanças de preço, evitando que a perda seja ignorada durante a liquidação.
A estratégia é totalmente baseada em indicadores e não tem uma lógica de discernimento de tendências complicada. A negociação automática pode ser implementada de forma muito simples.
Parâmetros como o ciclo ATR, o fator de amplificação e a amplitude de parada podem ser personalizados e podem ser otimizados para diferentes variedades de parâmetros, tornando a estratégia mais universal.
Embora a estratégia tenha muitos benefícios, há riscos a serem considerados:
A estratégia não determina a lógica do fim da tendência.
Se os parâmetros do ciclo ATR forem muito curtos, a linha de parada será muito sensível e pode ser desencadeada por frequentes situações de tremor.
A estratégia não considera o ponto de classificação como um ponto de suporte de parada. Portanto, a linha curta também pode ser jogada fora do mercado quando ela rebenta.
Para os riscos acima mencionados, é possível otimizar os seguintes aspectos:
Indicadores de tendência combinados com os indicadores de ondas de tendência para determinar a reversão de tendência antecipada
Teste de otimização de parâmetros, seleção da combinação de parâmetros mais adequada
Ampliação do limiar de perda perto de um determinado suporte
A estratégia ainda tem espaço para ser melhorada:
A probabilidade de uma reversão de tendência pode ser avaliada através da identificação de algumas formas típicas da linha K, tais como a curva de fundo, a estrela-foguete, etc. Isso evita o risco de uma queda de alta.
Os parâmetros como o ciclo ATR e o amplificador também podem ser modificados de forma dinâmica, usando um ciclo ATR mais longo e um alcance de suspensão mais amplo em mercados com grande volatilidade.
A LSTM, rnn e outros modelos de aprendizagem em profundidade são usados para prever os possíveis intervalos de preços no mercado de retalho e ajustar dinamicamente a distância de parada.
Esta estratégia global usa o indicador ATR para projetar a linha de stop loss móvel e introduz um mecanismo de stop loss de rastreamento, que pode ajustar o stop loss em tempo real de acordo com as mudanças no mercado. Isso permite um maior bloqueio de lucro, além de reduzir o risco. Com uma otimização adicional, a estratégia pode ser mais adaptável a várias situações do mercado, tornando-se uma estratégia de negociação mais flexível.
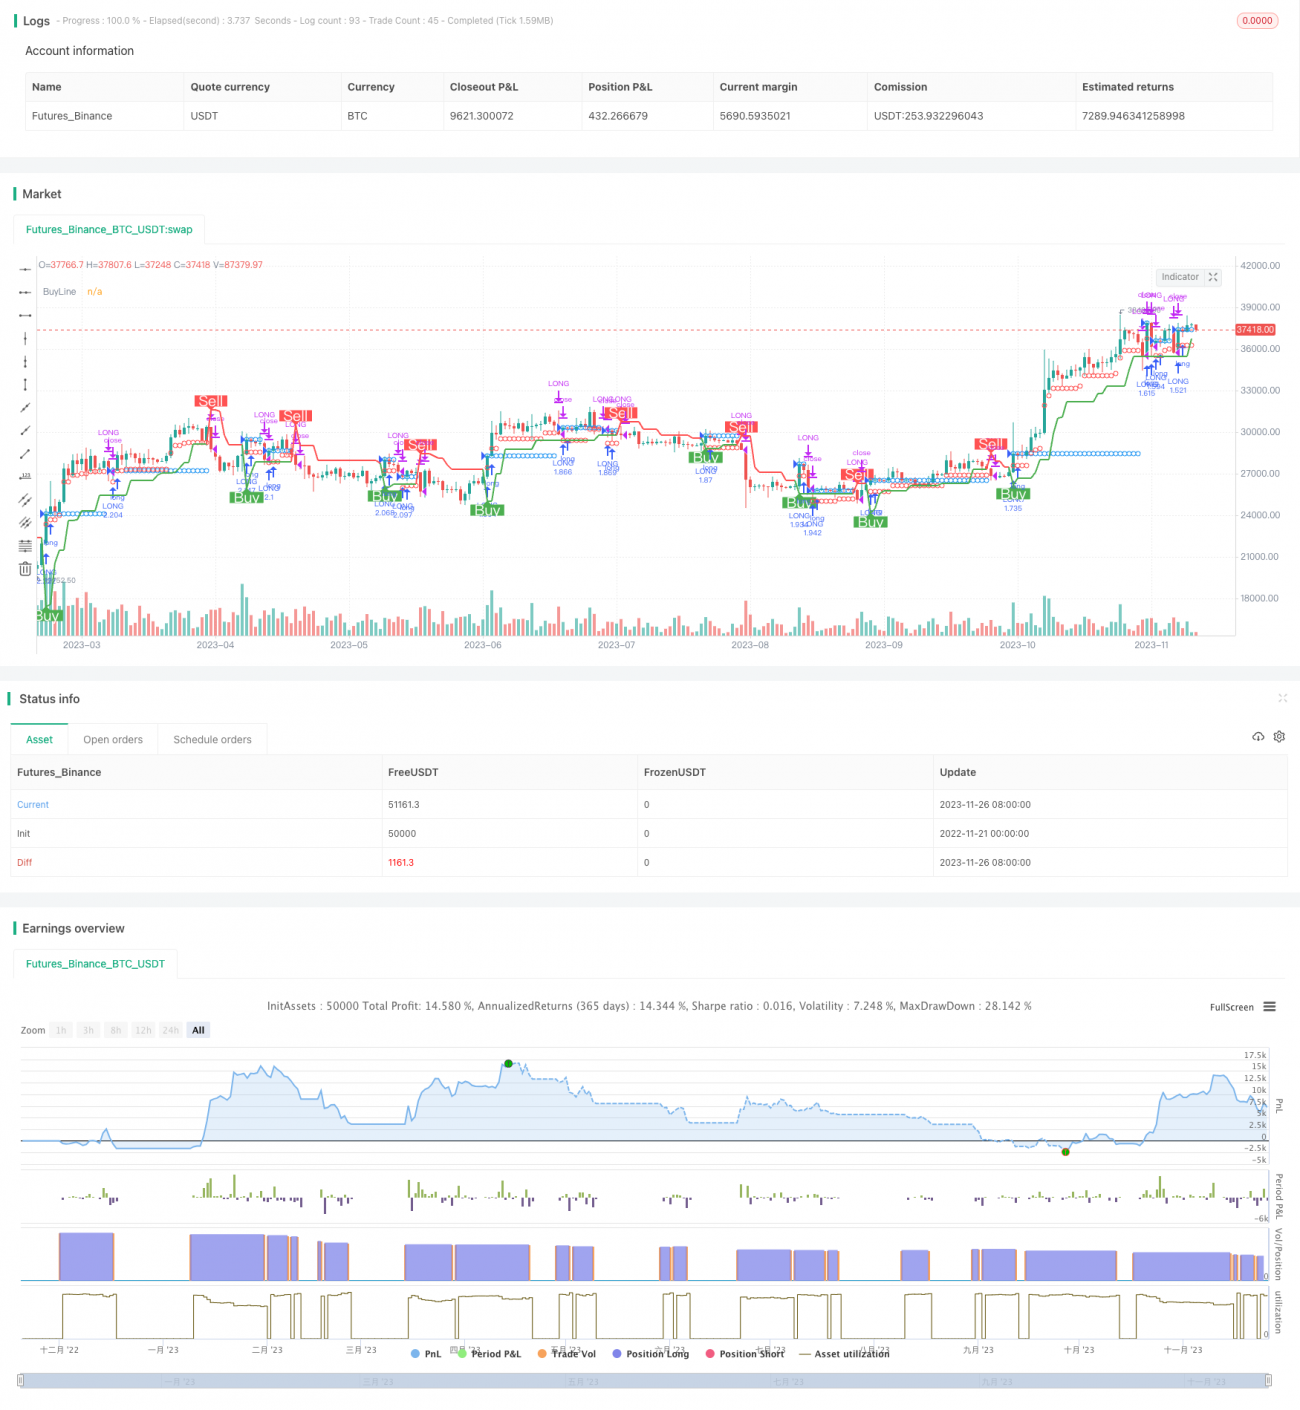
/*backtest
start: 2022-11-21 00:00:00
end: 2023-11-27 00:00:00
period: 1d
basePeriod: 1h
exchanges: [{"eid":"Futures_Binance","currency":"BTC_USDT"}]
*/
//@version=4
//
// ▒▒▒▒▒▒▒▒▒▒▒▒▒▒▒▒▒▒▒▒▒▒▒▒▒▒▒▒▒▒▒▒▒▒▒▒▒▒▒▒▒▒▒▒▒▒▒▒▒▒▒▒▒▒▒▒▒▒▒▒▒▒▒▒▒▒▒▒▒▒▒▒▒▒▒▒▒▒▒▒▒▒▒▒▒▒▒▒▒▒▒▒▒▒▒▒▒▒▒▒▒▒▒▒▒▒▒▒▒▒▒▒▒▒
// -----------------------------------------------------------------------------
// Copyright 2019 Mauricio Pimenta | exit490
// SuperTrend with Trailing Stop Loss script may be freely distributed under the MIT license.
//
// Permission is hereby granted, free of charge,
// to any person obtaining a copy of this software and associated documentation files (the "Software"),
// to deal in the Software without restriction, including without limitation the rights to use, copy, modify, merge,
// publish, distribute, sublicense, and/or sell copies of the Software, and to permit persons to whom the Software is furnished to do so,
// subject to the following conditions:
//
// The above copyright notice and this permission notice shall be included in all copies or substantial portions of the Software.
//
// THE SOFTWARE IS PROVIDED "AS IS", WITHOUT WARRANTY OF ANY KIND,
// EXPRESS OR IMPLIED, INCLUDING BUT NOT LIMITED TO THE WARRANTIES OF MERCHANTABILITY,
// FITNESS FOR A PARTICULAR PURPOSE AND NONINFRINGEMENT. IN NO EVENT SHALL THE AUTHORS OR COPYRIGHT HOLDERS BE LIABLE FOR ANY CLAIM,
// DAMAGES OR OTHER LIABILITY, WHETHER IN AN ACTION OF CONTRACT, TORT OR OTHERWISE, ARISING FROM,
// OUT OF OR IN CONNECTION WITH THE SOFTWARE OR THE USE OR OTHER DEALINGS IN THE SOFTWARE.
//
// -----------------------------------------------------------------------------
//
// Authors: @exit490
// Revision: v1.0.0
// Date: 5-Aug-2019
//
// Description
// ===========
// SuperTrend is a moving stop and reversal line based on the volatility (ATR).
// The strategy will ride up your stop loss when price moviment 1%.
// The strategy will close your operation when the market price crossed the stop loss.
// The strategy will close operation when the line based on the volatility will crossed
//
// The strategy has the following parameters:
//
// INITIAL STOP LOSS - Where can isert the value to first stop.
// POSITION TYPE - Where can to select trade position.
// ATR PERIOD - To select number of bars back to execute calculation
// ATR MULTPLIER - To add a multplier factor on volatility
// BACKTEST PERIOD - To select range.
//
// -----------------------------------------------------------------------------
// Disclaimer:
// 1. I am not licensed financial advisors or broker dealers. I do not tell you
// when or what to buy or sell. I developed this software which enables you
// execute manual or automated trades multplierFactoriplierFactoriple trades using TradingView. The
// software allows you to set the criteria you want for entering and exiting
// trades.
// 2. Do not trade with money you cannot afford to lose.
// 3. I do not guarantee consistent profits or that anyone can make money with no
// effort. And I am not selling the holy grail.
// 4. Every system can have winning and losing streaks.
// 5. Money management plays a large role in the results of your trading. For
// example: lot size, account size, broker leverage, and broker margin call
// rules all have an effect on results. Also, your Take Profit and Stop Loss
// settings for individual pair trades and for overall account equity have a
// major impact on results. If you are new to trading and do not understand
// these items, then I recommend you seek education materials to further your
// knowledge.
//
// YOU NEED TO FIND AND USE THE TRADING SYSTEM THAT WORKS BEST FOR YOU AND YOUR
// TRADING TOLERANCE.
//
// I HAVE PROVIDED NOTHING MORE THAN A TOOL WITH OPTIONS FOR YOU TO TRADE WITH THIS PROGRAM ON TRADINGVIEW.
//
// I accept suggestions to improve the script.
// If you encounter any problems I will be happy to share with me.
// -----------------------------------------------------------------------------
//
// ▒▒▒▒▒▒▒▒▒▒▒▒▒▒▒▒▒▒▒▒▒▒▒▒▒▒▒▒▒▒▒▒▒▒▒▒▒▒▒▒▒▒▒▒▒▒▒▒▒▒▒▒▒▒▒▒▒▒▒▒▒▒▒▒▒▒▒▒▒▒▒▒▒▒▒▒▒▒▒▒▒▒▒▒▒▒▒▒▒▒▒▒▒▒▒▒▒▒▒▒▒▒▒▒▒▒▒▒▒▒▒▒▒▒ //
strategy(title = "SUPERTREND ATR WITH TRAILING STOP LOSS",
shorttitle = "SUPERTREND ATR WITH TSL",
overlay = true,
precision = 8,
calc_on_order_fills = true,
calc_on_every_tick = true,
backtest_fill_limits_assumption = 0,
default_qty_type = strategy.percent_of_equity,
default_qty_value = 100,
initial_capital = 1000,
currency = currency.USD,
linktoseries = true)
//
// ▒▒▒▒▒▒▒▒▒▒▒▒▒▒▒▒▒▒▒▒▒▒▒▒▒▒▒▒▒▒▒▒▒▒▒▒▒▒▒▒▒▒▒▒▒▒▒▒▒▒▒▒▒▒▒▒▒▒▒▒▒▒▒▒▒▒▒▒▒▒▒▒▒▒▒▒▒▒▒▒▒▒▒▒▒▒▒▒▒▒▒▒▒▒▒▒▒▒▒▒▒▒▒▒▒▒▒▒▒▒▒▒▒▒ //
// === BACKTEST RANGE ===
backTestSectionFrom = input(title = "═══════════════ FROM ═══════════════", defval = true, type = input.bool)
FromMonth = input(defval = 1, title = "Month", minval = 1)
FromDay = input(defval = 1, title = "Day", minval = 1)
FromYear = input(defval = 2019, title = "Year", minval = 2014)
backTestSectionTo = input(title = "════════════════ TO ════════════════", defval = true, type = input.bool)
ToMonth = input(defval = 31, title = "Month", minval = 1)
ToDay = input(defval = 12, title = "Day", minval = 1)
ToYear = input(defval = 9999, title = "Year", minval = 2014)
backTestPeriod() => (time > timestamp(FromYear, FromMonth, FromDay, 00, 00)) and (time < timestamp(ToYear, ToMonth, ToDay, 23, 59))
//
// ▒▒▒▒▒▒▒▒▒▒▒▒▒▒▒▒▒▒▒▒▒▒▒▒▒▒▒▒▒▒▒▒▒▒▒▒▒▒▒▒▒▒▒▒▒▒▒▒▒▒▒▒▒▒▒▒▒▒▒▒▒▒▒▒▒▒▒▒▒▒▒▒▒▒▒▒▒▒▒▒▒▒▒▒▒▒▒▒▒▒▒▒▒▒▒▒▒▒▒▒▒▒▒▒▒▒▒▒▒▒▒▒▒▒ //
parameterSection = input(title = "═════════════ STRATEGY ═════════════", defval = true, type = input.bool)
// === INPUT TO SELECT POSITION ===
positionType = input(defval="LONG", title="Position Type", options=["LONG", "SHORT"])
// === INPUT TO SELECT INITIAL STOP LOSS
initialStopLossPercent = input(defval = 3.0, minval = 0.0, title="Initial Stop Loss")
// === INPUT TO SELECT BARS BACK
barsBack = input(title="ATR Period", defval=1)
// === INPUT TO SELECT MULTPLIER FACTOR
multplierFactor = input(title="ATR multplierFactoriplier", step=0.1, defval=3.0)
//
// ▒▒▒▒▒▒▒▒▒▒▒▒▒▒▒▒▒▒▒▒▒▒▒▒▒▒▒▒▒▒▒▒▒▒▒▒▒▒▒▒▒▒▒▒▒▒▒▒▒▒▒▒▒▒▒▒▒▒▒▒▒▒▒▒▒▒▒▒▒▒▒▒▒▒▒▒▒▒▒▒▒▒▒▒▒▒▒▒▒▒▒▒▒▒▒▒▒▒▒▒▒▒▒▒▒▒▒▒▒▒▒▒▒▒ //
// LOGIC TO FIND DIRECTION WHEN THERE IS TREND CHANGE ACCORDING VOLATILITY
atr = multplierFactor * atr(barsBack)
longStop = hl2 - atr
longStopPrev = nz(longStop[1], longStop)
longStop := close[1] > longStopPrev ? max(longStop, longStopPrev) : longStop
shortStop = hl2 + atr
shortStopPrev = nz(shortStop[1], shortStop)
shortStop := close[1] < shortStopPrev ? min(shortStop, shortStopPrev) : shortStop
direction = 1
direction := nz(direction[1], direction)
direction := direction == -1 and close > shortStopPrev ? 1 : direction == 1 and close < longStopPrev ? -1 : direction
longColor = color.blue
shortColor = color.blue
var valueToPlot = 0.0
var colorToPlot = color.white
if (direction == 1)
valueToPlot := longStop
colorToPlot := color.green
else
valueToPlot := shortStop
colorToPlot := color.red
//
// ▒▒▒▒▒▒▒▒▒▒▒▒▒▒▒▒▒▒▒▒▒▒▒▒▒▒▒▒▒▒▒▒▒▒▒▒▒▒▒▒▒▒▒▒▒▒▒▒▒▒▒▒▒▒▒▒▒▒▒▒▒▒▒▒▒▒▒▒▒▒▒▒▒▒▒▒▒▒▒▒▒▒▒▒▒▒▒▒▒▒▒▒▒▒▒▒▒▒▒▒▒▒▒▒▒▒▒▒▒▒▒▒▒▒ //
//
// === GLOBAL VARIABLES AND FUNCTIONS TO STORE IMPORTANT CONDITIONALS TO TRAILING STOP
hasEntryLongConditional() => direction == 1
hasCloseLongConditional() => direction == -1
hasEntryShortConditional() => direction == -1
hasCloseShortConditional() => direction == 1
stopLossPercent = positionType == "LONG" ? initialStopLossPercent * -1 : initialStopLossPercent
var entryPrice = 0.0
var updatedEntryPrice = 0.0
var stopLossPrice = 0.0
hasOpenTrade() => strategy.opentrades != 0
notHasOpenTrade() => strategy.opentrades == 0
strategyClose() =>
if positionType == "LONG"
strategy.close("LONG", when=true)
else
strategy.close("SHORT", when=true)
strategyOpen() =>
if positionType == "LONG"
strategy.entry("LONG", strategy.long, when=true)
else
strategy.entry("SHORT", strategy.short, when=true)
isLong() => positionType == "LONG" ? true : false
isShort() => positionType == "SHORT" ? true : false
//
// ▒▒▒▒▒▒▒▒▒▒▒▒▒▒▒▒▒▒▒▒▒▒▒▒▒▒▒▒▒▒▒▒▒▒▒▒▒▒▒▒▒▒▒▒▒▒▒▒▒▒▒▒▒▒▒▒▒▒▒▒▒▒▒▒▒▒▒▒▒▒▒▒▒▒▒▒▒▒▒▒▒▒▒▒▒▒▒▒▒▒▒▒▒▒▒▒▒▒▒▒▒▒▒▒▒▒▒▒▒▒▒▒▒▒ //
//
// === LOGIC TO TRAILING STOP IN LONG POSITION
if (isLong() and backTestPeriod())
crossedStopLoss = close <= stopLossPrice
terminateOperation = hasOpenTrade() and (crossedStopLoss or hasCloseLongConditional())
if (terminateOperation)
entryPrice := 0.0
updatedEntryPrice := entryPrice
stopLossPrice := 0.0
strategyClose()
startOperation = notHasOpenTrade() and hasEntryLongConditional()
if(startOperation)
entryPrice := close
updatedEntryPrice := entryPrice
stopLossPrice := entryPrice + (entryPrice * stopLossPercent) / 100
strategyOpen()
strategyPercentege = (close - updatedEntryPrice) / updatedEntryPrice * 100.00
rideUpStopLoss = hasOpenTrade() and strategyPercentege > 1
if (isLong() and rideUpStopLoss)
stopLossPercent := stopLossPercent + strategyPercentege - 1.0
newStopLossPrice = updatedEntryPrice + (updatedEntryPrice * stopLossPercent) / 100
stopLossPrice := max(stopLossPrice, newStopLossPrice)
updatedEntryPrice := stopLossPrice
//
// ▒▒▒▒▒▒▒▒▒▒▒▒▒▒▒▒▒▒▒▒▒▒▒▒▒▒▒▒▒▒▒▒▒▒▒▒▒▒▒▒▒▒▒▒▒▒▒▒▒▒▒▒▒▒▒▒▒▒▒▒▒▒▒▒▒▒▒▒▒▒▒▒▒▒▒▒▒▒▒▒▒▒▒▒▒▒▒▒▒▒▒▒▒▒▒▒▒▒▒▒▒▒▒▒▒▒▒▒▒▒▒▒▒▒ //
//
// === LOGIC TO TRAILING STOP IN SHORT POSITION
if (isShort() and backTestPeriod())
crossedStopLoss = close >= stopLossPrice
terminateOperation = hasOpenTrade() and (crossedStopLoss or hasCloseShortConditional())
if (terminateOperation)
entryPrice := 0.0
updatedEntryPrice := entryPrice
stopLossPrice := 0.0
strategyClose()
startOperation = notHasOpenTrade() and hasEntryShortConditional()
if(startOperation)
entryPrice := close
updatedEntryPrice := entryPrice
stopLossPrice := entryPrice + (entryPrice * stopLossPercent) / 100
strategyOpen()
strategyPercentege = (close - updatedEntryPrice) / updatedEntryPrice * 100.00
rideDownStopLoss = hasOpenTrade() and strategyPercentege < -1
if (rideDownStopLoss)
stopLossPercent := stopLossPercent + strategyPercentege + 1.0
newStopLossPrice = updatedEntryPrice + (updatedEntryPrice * stopLossPercent) / 100
stopLossPrice := min(stopLossPrice, newStopLossPrice)
updatedEntryPrice := stopLossPrice
//
// ▒▒▒▒▒▒▒▒▒▒▒▒▒▒▒▒▒▒▒▒▒▒▒▒▒▒▒▒▒▒▒▒▒▒▒▒▒▒▒▒▒▒▒▒▒▒▒▒▒▒▒▒▒▒▒▒▒▒▒▒▒▒▒▒▒▒▒▒▒▒▒▒▒▒▒▒▒▒▒▒▒▒▒▒▒▒▒▒▒▒▒▒▒▒▒▒▒▒▒▒▒▒▒▒▒▒▒▒▒▒▒▒▒▒
//
// === DRAWING SHAPES
entryPricePlotConditinal = entryPrice == 0.0 ? na : entryPrice
trailingStopLossPlotConditional = stopLossPrice == 0.0 ? na : stopLossPrice
plotshape(entryPricePlotConditinal, title= "Entry Price", color=color.blue, style=shape.circle, location=location.absolute, size=size.tiny)
plotshape(trailingStopLossPlotConditional, title= "Stop Loss", color=color.red, style=shape.circle, location=location.absolute, size=size.tiny)
plot(valueToPlot == 0.0 ? na : valueToPlot, title="BuyLine", linewidth=2, color=colorToPlot)
plotshape(direction == 1 and direction[1] == -1 ? longStop : na, title="Buy", style=shape.labelup, location=location.absolute, size=size.normal, text="Buy", transp=0, textcolor = color.white, color=color.green, transp=0)
plotshape(direction == -1 and direction[1] == 1 ? shortStop : na, title="Sell", style=shape.labeldown, location=location.absolute, size=size.normal, text="Sell", transp=0, textcolor = color.white, color=color.red, transp=0)
alertcondition(direction == 1 and direction[1] == -1 ? longStop : na, title="Buy", message="Buy!")
alertcondition(direction == -1 and direction[1] == 1 ? shortStop : na, title="Sell", message="Sell!")