Estratégia de Crossover de Média Móvel Dupla

Visão geral
A estratégia é baseada em uma dupla linha média cruzada. Combina uma média móvel simples rápida (SMA) e uma média móvel lentamente ponderada (VWMA) para formar um sinal de compra e venda usando a cruz das duas médias.
Quando o SMA rápido atravessa o VWMA lento para cima, gera um sinal de compra; quando o SMA rápido atravessa o VWMA lento para baixo, gera um sinal de venda. A estratégia usa um mecanismo de controle de risco de parada.
Princípio da estratégia
A lógica central da estratégia baseia-se no sistema de duplo equilíbrio de cruzamentos. Em particular, ela usa simultaneamente os seguintes indicadores técnicos:
- Média Móvel Simples (SMA): Média aritmética dos preços de fechamento dos últimos n dias, que refletem os preços médios dos últimos períodos.
- Média móvel ponderada (VWMA): média ponderada dos preços de fechamento dos últimos n dias, dando maior peso aos preços recentes e respondendo mais rapidamente às mudanças de preços.
Os parâmetros rápidos de SMA na dupla linha média são mais curtos e respondem rapidamente às mudanças de preço; os VWMA lentos são mais longos e têm um efeito de onda. Quando as tendências de curto e longo prazo se movem na mesma direção, o SMA rápido que atravessa o VWMA lento produz um sinal de compra; quando atravessa o VWMA lento produz um sinal de venda.
A estratégia também estabelece um mecanismo de parada de perda. Quando o preço se move na direção negativa, a parada de perda é feita em tempo hábil para controlar o risco.
Análise de vantagens
- Responder rapidamente e acompanhar as mudanças nas tendências do mercado
- Retiradas controladas, mecanismos de parada de prejuízos controlados
- Simples, intuitivo e fácil de entender
- Pode ser otimizado para adaptar-se a diferentes circunstâncias de mercado, ajustando os parâmetros
Análise de Riscos
- Estratégias de dupla linha média podem gerar falsos sinais de mercado múltipla
- A necessidade de escolher os parâmetros adequados, que podem resultar em prejuízos
- A dor de cabeça pode ocasionalmente causar danos em Markt.
Métodos de controle de risco:
- Confirmação por meio de indicadores de filtragem de tendências
- Optimizar configurações de parâmetros
- Adotar estratégias de prevenção de perdas e controle racional de perdas individuais
Direção de otimização
A estratégia pode ser melhorada em vários aspectos:
- Confirmação em combinação com outros indicadores técnicos, como RSI, linhas de Brin, etc., para melhorar a precisão do sinal
- Optimizar o comprimento dos parâmetros da linha média, ajustando os parâmetros de acordo com diferentes períodos
- Combinação de indicadores de volume de transação para transações em pontos de entrada e saída de energia
- Ajuste de parâmetros de acordo com os resultados da retomada e selecione o parâmetro ideal
- O uso de stop loss dinâmico para ajustar o ponto de parada de acordo com a volatilidade do mercado
Resumir
A estratégia é uma estratégia de acompanhamento de tendências muito prática como um todo. Usando uma simples e intuitiva dupla linha média de cruzamento para gerar sinais de negociação, é capaz de capturar efetivamente as mudanças na tendência do mercado por meio da combinação de uma linha média rápida e uma linha média lenta. O mecanismo de parada também permite um bom controle de risco.
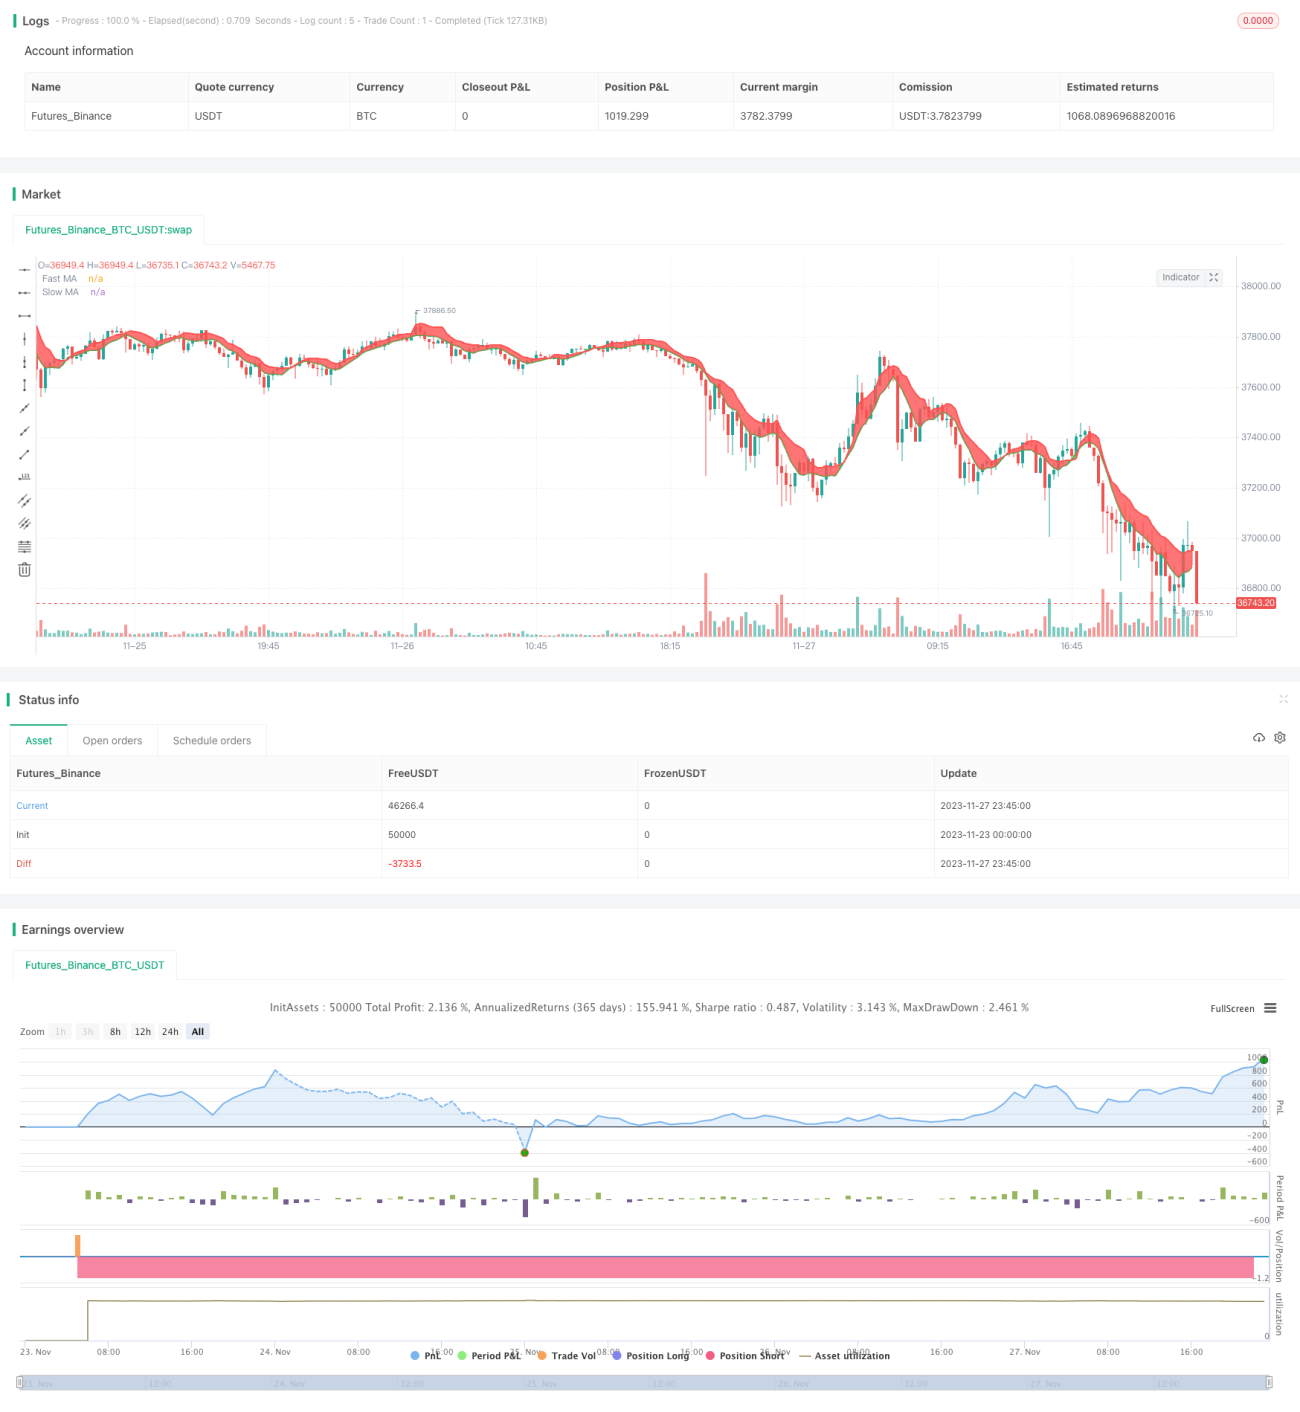
/*backtest
start: 2023-11-23 00:00:00
end: 2023-11-28 00:00:00
period: 15m
basePeriod: 5m
exchanges: [{"eid":"Futures_Binance","currency":"BTC_USDT"}]
*/

//@version=4
//strategy(title="Bitlinc Entry v0.1 VWMA / SMA / MRSI SQQQ 94M", overlay=true, initial_capital=10000, currency='USD')

strategy(title="Bitlinc Entry v0.1 VWMA / SMA / MRSI SQQQ 94M", overlay=true)- 1