
A estratégia é uma estratégia de parada de perda de seguimento de tendências baseada no indicador de tendência flexível do Dr. John Ehlers (Trend Flex Oscillator, TFO) e no Average True Range (Average True Range, ATR). Aplica-se a mercados de ativos, abrindo posições de ativos quando há uma reversão de preços após o Overold.
A estratégia combina os dois indicadores TFO e ATR, abrindo uma posição a mais quando as condições de compra são cumpridas e a menos quando as condições de venda são cumpridas.
Condições de compra: Quando o TFO está abaixo de um determinado limiar (indicando um excesso de vazio) e o valor do TFO na linha K superior está abaixo da linha K atual (indicando que o TFO inverte para cima) e o ATR está acima do limiar de flutuação definido (indicando que a flutuação do mercado aumenta), as três condições são preenchidas.
Condições de posição de equilíbrio: todas as posições de equilíbrio são liquidadas quando o TFO é superior a um determinado limite (expressão de excesso de cabeça) e o ATR é superior ao limite definido. Além disso, a estratégia também define um stop loss de acompanhamento, que também elimina todas as posições de equilíbrio quando o preço cai abaixo do preço de stop loss de acompanhamento definido. Os usuários podem optar por permitir que a estratégia seja liquidada de acordo com o sinal do indicador ou apenas de acordo com o preço de equilíbrio de perda.
A estratégia permite abrir até 15 posições simultâneas. Os parâmetros podem ser ajustados para diferentes períodos de tempo.
A combinação de tendências e oscilações determina a direção do mercado e é mais estável. O TFO pode capturar os sinais iniciais de ruptura de tendências, enquanto o ATR pode capturar o momento em que as flutuações do mercado aumentam.
A configuração de parâmetros de compra e venda ajustáveis e parâmetros de parada de perda, operação flexível. O usuário pode ajustar os parâmetros de acordo com o mercado, para obter otimização.
A função de stop loss é incorporada para reduzir a perda em situações extremas. A estratégia de stop loss é uma parte muito importante do trading quantitativo.
Suporte a abertura de posições adicionais e a eliminação parcial de posições, permitindo aumentar o lucro através do aumento da posição.
A estratégia de fazer mais, não fazer menos e não ser capaz de lucrar em um mercado em baixa. Pode causar grandes perdas em um mercado em baixa.
A configuração inadequada dos parâmetros pode levar a excesso de negociação ou a falta de negociação. Testes repetidos são necessários para encontrar a melhor combinação de parâmetros.
Em casos extremos, o Stop Loss pode ser ineficaz e não impedir a ocorrência de grandes perdas. Este é um problema que todas as estratégias de Stop Loss podem enfrentar.
A retrospectiva não reflete completamente a situação das transações em ações reais, e os resultados em ações reais podem ter um certo desequilíbrio.
Pode-se considerar a inclusão de uma linha de stop móvel nas condições de venda, para que a estratégia pare os perdas em tempo hábil e controle efetivamente o risco de queda.
Pode-se expandir o mecanismo de tomada de posições em aberto, abrindo posições em aberto quando o TFO inverter a queda e o ATR for grande o suficiente para que a estratégia possa ser aplicada ao mercado de capitais em aberto.
Pode-se adicionar mais condições de filtragem, como variações de volume de negócios, para reduzir a influência de comportamentos anormais na estratégia.
É possível testar configurações de parâmetros e resultados de retomada em diferentes períodos de tempo, procurando o melhor ciclo e combinação de parâmetros.
A estratégia integra os benefícios da análise de tendências e do monitoramento da volatilidade para determinar a direção do mercado por meio de uma combinação de indicadores TFO e ATR. A estratégia possui mecanismos como a abertura de posições adicionais, a liquidação parcial e o stop loss móvel para aumentar a lucratividade e controlar o risco, adequado para a prática de múltiplos operadores.
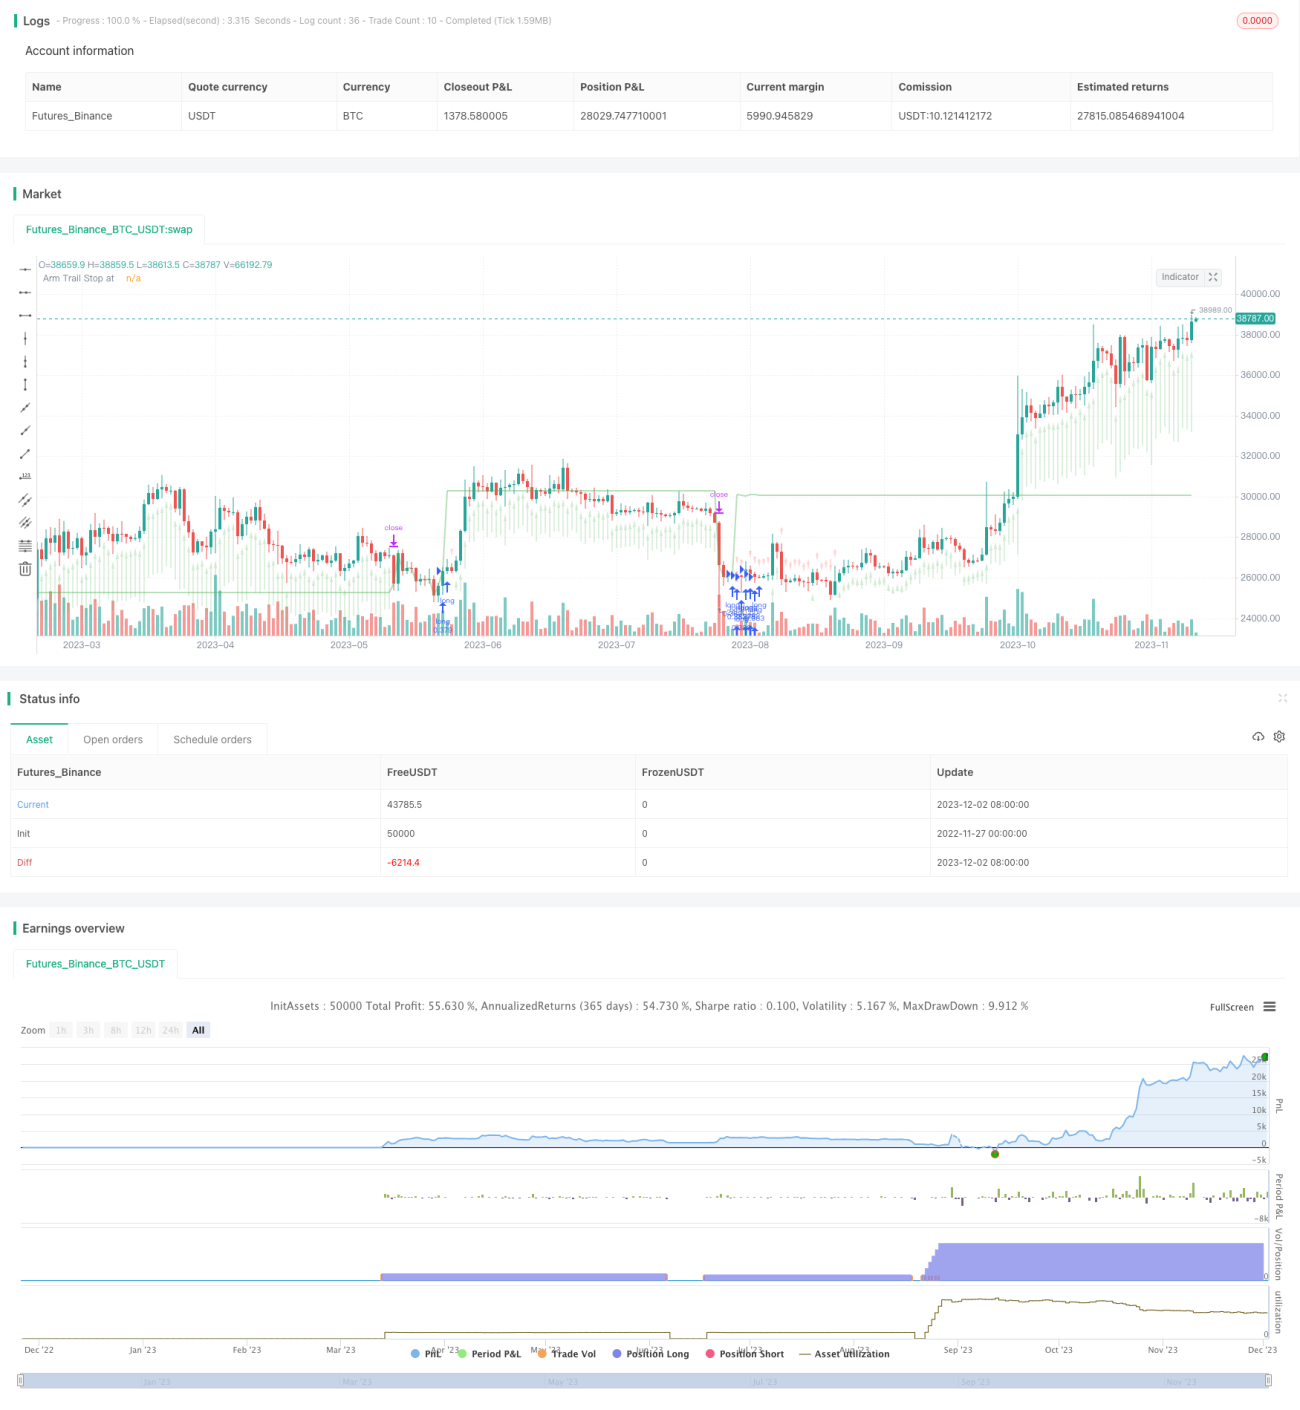
/*backtest
start: 2022-11-27 00:00:00
end: 2023-12-03 00:00:00
period: 1d
basePeriod: 1h
exchanges: [{"eid":"Futures_Binance","currency":"BTC_USDT"}]
*/
// This source code is subject to the terms of the Mozilla Public License 2.0 at https://mozilla.org/MPL/2.0/
// © Chart0bserver
//
// Open Source attributions:
// portions © allanster (date window code)
// portions © Dr. John Ehlers (Trend Flex Oscillator)
//
// READ THIS CAREFULLY!!! ----------------//
// This code is provided for educational purposes only. The results of this strategy should not be considered investment advice.
// The user of this script acknolwedges that it can cause serious financial loss when used as a trading tool
// This strategy has a bias for HODL (Holds on to Losses) meaning that it provides NO STOP LOSS protection!
// Also note that the default behavior is designed for up to 15 open long orders, and executes one order to close them all at once.
// Opening a long position is predicated on The Trend Flex Oscillator (TFO) rising after being oversold, and ATR above a certain volatility threshold.
// Closing a long is handled either by TFO showing overbought while above a certain ATR level, or the Trailing Stop Loss. Pick one or both.
// If the strategy is allowed to sell before a Trailing Stop Loss is triggered, you can set a "must exceed %". Do not mistake this for a stop loss.
// Short positions are not supported in this version. Back-testing should NEVER be considered an accurate representation of actual trading results.
//@version=5
strategy('TFO + ATR Strategy with Trailing Stop Loss', 'TFO ATR Trailing Stop Loss', overlay=true, pyramiding=15, default_qty_type=strategy.cash, default_qty_value=10000, initial_capital=150000, currency='USD', commission_type=strategy.commission.percent, commission_value=0.5)
strategy.risk.allow_entry_in(strategy.direction.long) // There will be no short entries, only exits from long.
// -----------------------------------------------------------------------------------------------------------//
// Back-testing Date Range code ----------------------------------------------------------------------------//
// ---------------------------------------------------------------------------------------------------------//
fromMonth = input.int(defval=9, title='From Month', minval=1, maxval=12, group='Back-Testing Start Date')
fromDay = input.int(defval=1, title='From Day', minval=1, maxval=31, group='Back-Testing Start Date')
fromYear = input.int(defval=2021, title='From Year', minval=1970, group='Back-Testing Start Date')
thruMonth = 1 //input(defval = 1, title = "Thru Month", type = input.integer, minval = 1, maxval = 12, group="Back-Testing Date Range")
thruDay = 1 //input(defval = 1, title = "Thru Day", type = input.integer, minval = 1, maxval = 31, group="Back-Testing Date Range")
thruYear = 2112 //input(defval = 2112, title = "Thru Year", type = input.integer, minval = 1970, group="Back-Testing Date Range")
// === FUNCTION EXAMPLE ===
start = timestamp(fromYear, fromMonth, fromDay, 00, 00) // backtest start window
finish = timestamp(thruYear, thruMonth, thruDay, 23, 59) // backtest finish window
window() => // create function "within window of time
time >= start and time <= finish ? true : false
// Date range code -----//
// -----------------------------------------------------------------------------------------------------------//
// ATR Indicator Code --------------------------------------------------------------------------------------//
// ---------------------------------------------------------------------------------------------------------//
length = 18 //input(title="ATR Length", defval=18, minval=1)
Period = 18 //input(18,title="ATR EMA Period")
basicEMA = ta.ema(close, length)
ATR_Function = ta.ema(ta.tr(true), length)
EMA_ATR = ta.ema(ATR_Function, Period)
ATR = ta.ema(ta.tr(true), length)
ATR_diff = ATR - EMA_ATR
volatility = 100 * ATR_diff / EMA_ATR // measure of spread between ATR and EMA
volatilityAVG = math.round((volatility + volatility[1] + volatility[2]) / 3)
buyVolatility = input.int(3, 'Min Volatility for Buy', minval=-20, maxval=20, step=1, group='Average True Range')
sellVolatility = input.int(13, 'Min Volatility for Sell', minval=-10, maxval=20, step=1, group='Average True Range')
useAvgVolatility = input.bool(defval=false, title='Average the Volatility over 3 bars', group='Average True Range')
// End of ATR ------------/
// -----------------------------------------------------------------------------------------------------------//
// TFO Indicator code --------------------------------------------------------------------------------------//
// ---------------------------------------------------------------------------------------------------------//
trendflex(Series, PeriodSS, PeriodTrendFlex, PeriodEMA) =>
var SQRT2xPI = math.sqrt(8.0) * math.asin(1.0) // 4.44288293815 Constant
alpha = SQRT2xPI / PeriodSS
beta = math.exp(-alpha)
gamma = -beta * beta
delta = 2.0 * beta * math.cos(alpha)
float superSmooth = na
superSmooth := (1.0 - delta - gamma) * (Series + nz(Series[1])) * 0.5 + delta * nz(superSmooth[1]) + gamma * nz(superSmooth[2])
E = 0.0
for i = 1 to PeriodTrendFlex by 1
E += superSmooth - nz(superSmooth[i])
E
epsilon = E / PeriodTrendFlex
zeta = 2.0 / (PeriodEMA + 1.0)
float EMA = na
EMA := zeta * epsilon * epsilon + (1.0 - zeta) * nz(EMA[1])
return_1 = EMA == 0.0 ? 0.0 : epsilon / math.sqrt(EMA)
return_1
upperLevel = input.float(1.2, 'TFO Upper Level', minval=0.1, maxval=2.0, step=0.1, group='Trend Flex Ocillator')
lowerLevel = input.float(-0.9, 'TFO Lower Level', minval=-2.0, maxval=-0.1, step=0.1, group='Trend Flex Ocillator')
periodTrendFlex = input.int(14, 'TrendFlex Period', minval=2, group='Trend Flex Ocillator')
useSuperSmootherOveride = true //input( true, "Apply SuperSmoother Override Below*", input.bool, group="Trend Flex Ocillator")
periodSuperSmoother = 8.0 //input(8.0, "SuperSmoother Period*", input.float , minval=4.0, step=0.5, group="Trend Flex Ocillator")
postSmooth = 33 //input(33.0, "Post Smooth Period**", input.float , minval=1.0, step=0.5, group="Trend Flex Ocillator")
trendFlexOscillator = trendflex(close, periodSuperSmoother, periodTrendFlex, postSmooth)
// End of TFO -------------//
// -----------------------------------------------------------------------------------------------------------//
// HODL Don't sell if losing n% ---------------------------------------------------------------------------- //
// ---------------------------------------------------------------------------------------------------------//
sellOnStrategy = input.bool(defval=true, title='Allow Stategy to close positions', group='Selling Conditions')
doHoldLoss = true // input(defval = true, title = "Strategy can sell for a loss", type = input.bool, group="Selling Conditions")
holdLoss = input.int(defval=0, title='Value (%) must exceed ', minval=-25, maxval=10, step=1, group='Selling Conditions')
totalInvest = strategy.position_avg_price * strategy.position_size
openProfitPerc = strategy.openprofit / totalInvest
bool acceptableROI = openProfitPerc * 100 > holdLoss
// -----------------------//
// -----------------------------------------------------------------------------------------------------------//
// Buying and Selling conditions -------------------------------------------------------------------------- //
// ---------------------------------------------------------------------------------------------------------//
if useAvgVolatility
volatility := volatilityAVG
volatility
tfoBuy = trendFlexOscillator < lowerLevel and trendFlexOscillator[1] < trendFlexOscillator // Always make a purchase if TFO is in this lowest range
atrBuy = volatility > buyVolatility
tfoSell = ta.crossunder(trendFlexOscillator, upperLevel)
consensusBuy = tfoBuy and atrBuy
consensusSell = tfoSell and volatility > sellVolatility
if doHoldLoss
consensusSell := consensusSell and acceptableROI
consensusSell
// --------------------//
// -----------------------------------------------------------------------------------------------------------//
// Tracing & Debugging --------------------------------------------------------------------------------------//
// ---------------------------------------------------------------------------------------------------------//
plotchar(strategy.opentrades, 'Number of open trades', ' ', location.top)
plotarrow(100 * openProfitPerc, 'Profit on open longs', color.new(color.green, 75), color.new(color.red, 75))
// plotchar(strategy.position_size, "Shares on hand", " ", location.top)
// plotchar(totalInvest, "Total Invested", " ", location.top)
// plotarrow(strategy.openprofit, "Open profit dollar amount", color.new(color.green,100), color.new(color.red, 100))
// plotarrow(strategy.netprofit, "Net profit for session", color.new(color.green,100), color.new(color.red, 100))
// plotchar(acceptableROI, "Acceptable ROI", " ", location.top)
// plotarrow(volatility, "ATR volatility value", color.new(color.green,75), color.new(color.red, 75))
// plotchar(strategy.position_avg_price, "Avgerage price of holdings", " ", location.top)
// plotchar(volatilityAVG, "AVG volatility", " ", location.top)
// plotchar(fiveBarsVal, "change in 5bars", " ", location.top)
// plotchar(crossingUp, "crossingUp", "x", location.belowbar, textcolor=color.white)
// plotchar(crossingDown, "crossingDn", "x", location.abovebar, textcolor=color.white)
// plotchar(strategy.closedtrades, "closedtrades", " ", location.top)
// plotchar(strategy.wintrades, "wintrades", " ", location.top)
// plotchar(strategy.losstrades, "losstrades", " ", location.top)
// plotchar(close, "close", " ", location.top)
//--------------------//
// -----------------------------------------------------------------------------------------------------------//
// Trade Alert Execution ------------------------------------------------------------------------------------//
// ---------------------------------------------------------------------------------------------------------//
strategy.entry('long', strategy.long, when=window() and consensusBuy, comment='long')
if sellOnStrategy
strategy.close('long', when=window() and consensusSell, qty_percent=100, comment='Strat')
// -----------------------------------------------------------------------------------------------------------//
// Trailing Stop Loss logic -------------------------------------------------------------------------------- //
// ---------------------------------------------------------------------------------------------------------//
useTrailStop = input.bool(defval=true, title='Set Trailing Stop Loss on avg positon value', group='Selling Conditions')
arm = input.float(defval=15, title='Trailing Stop Arms At (%)', minval=1, maxval=30, step=1, group='Selling Conditions') * 0.01
trail = input.float(defval=2, title='Trailing Stop Loss (%)', minval=0.25, maxval=9, step=0.25, group='Selling Conditions') * 0.1
longStopPrice = 0.0
stopLossPrice = 0.0
if strategy.position_size > 0
longStopPrice := strategy.position_avg_price * (1 + arm)
stopLossPrice := strategy.position_avg_price * ((100 - math.abs(holdLoss)) / 100) // for use with 'stop' in strategy.exit
stopLossPrice
else
longStopPrice := close
longStopPrice
// If you want to hide the Trailing Stop Loss threshold (green line), comment this out
plot(longStopPrice, 'Arm Trail Stop at', color.new(color.green, 60), linewidth=2)
if strategy.position_size > 0 and useTrailStop
strategy.exit('exit', 'long', when=window(), qty_percent=100, trail_price=longStopPrice, trail_offset=trail * close / syminfo.mintick, comment='Trail')
//-----------------------------------------------------------------------------------------------------------//