Estratégia de negociação de swing adaptável com base em rompimentos de preços

1
Follow
1779
Followers
Visão geral
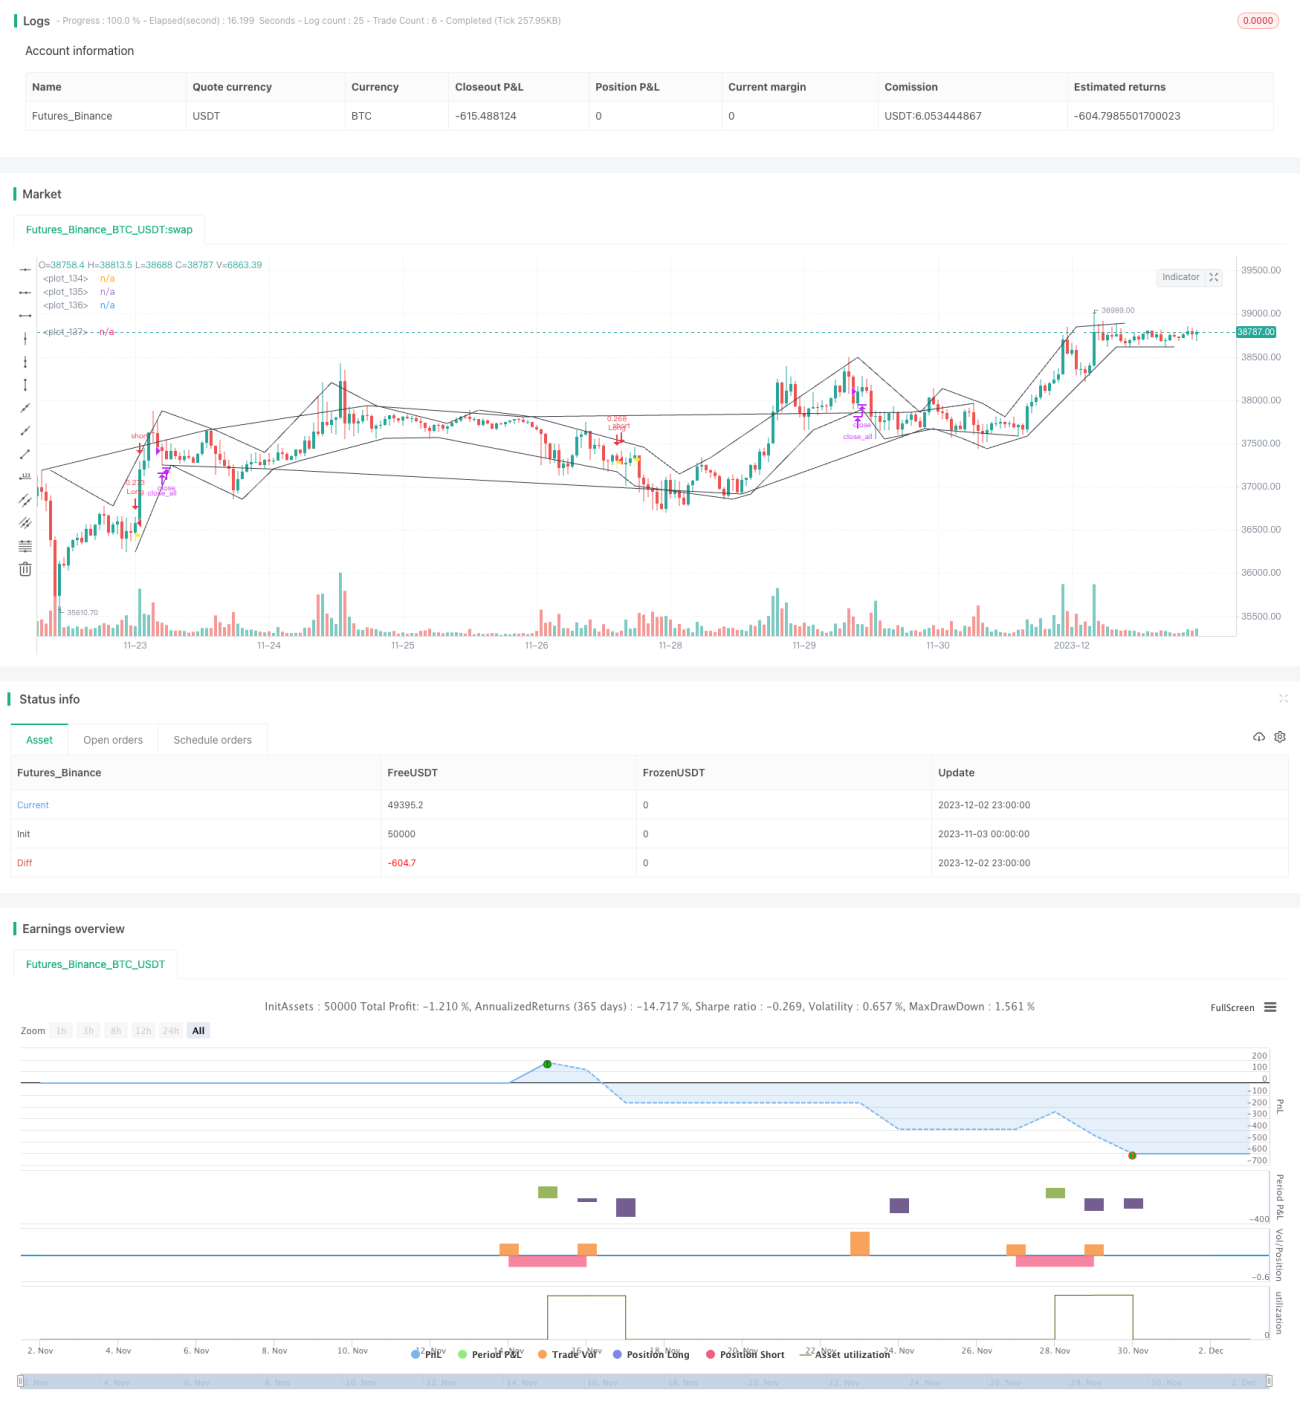
A estratégia identifica tendências de mercado com base em pontos de ruptura de preços e combina a avaliação de grandes tendências com indicadores de auto-adaptação para capturar oportunidades de reversão de preços em curto prazo. A estratégia é adequada para negociações de moedas digitais com alta volatilidade.
Princípio da estratégia
- Identificar o ponto de extremo de preço como a fronteira do canal. Quando o preço cria um novo alto ou um novo baixo, use esse ponto como a fronteira do canal.
- Calcule a MA de flutuação adaptativa para determinar a direção da tendência geral. Quanto maior o MA, maior é a fase de turbulência.
- Quando o preço se move para cima, ele gera um sinal de compra; quando o preço se move para baixo, ele gera um sinal de venda.
- Estabelecer um ponto de parada. Estabelecer um ponto de parada para uma posição longa de 1% do preço de entrada.
Análise de vantagens
- Os canais de preços são auto-adaptáveis e podem ser usados para determinar pontos de mudança de tendência com precisão.
- Os indicadores de flutuação são usados para avaliar as grandes tendências e evitar que as grandes tendências se desloquem.
- Uma estratégia de reversão, apropriada para capturar uma reversão de curto prazo.
Análise de Riscos
- Em um cenário de queda contínua e significativa, é fácil desencadear vários pontos de parada, causando grandes perdas.
- A compra e venda de ações aumentaram as taxas de transação durante a crise.
- A entrada é mantida manualmente, e as transações totalmente automáticas apresentam riscos de inadimplência.
Direção de otimização
- Optimizar os parâmetros do MA para que ele possa avaliar melhor a tendência geral.
- Aumentar os indicadores de energia e evitar o sinal de retorno do esgotamento energético.
- Adição de modelos de aprendizagem de máquina para otimização dinâmica dos parâmetros.
Resumir
A estratégia é clara e tem um certo valor prático. No entanto, é necessário ter cuidado para controlar o risco de negociação e evitar grandes perdas em situações específicas. O próximo passo pode ser otimizado a partir de várias dimensões, como o quadro geral, os parâmetros do indicador e o controle de risco, tornando os parâmetros da estratégia e os sinais de negociação mais confiáveis.
Source
Pine
/*backtest
start: 2023-11-03 00:00:00
end: 2023-12-03 00:00:00
period: 1h
basePeriod: 15m
exchanges: [{"eid":"Futures_Binance","currency":"BTC_USDT"}]
*/

// @version = 4
// This source code is subject to the terms of the Mozilla Public License 2.0 at https://mozilla.org/MPL/2.0/
// © TradingGroundhog
Strategy parameters
Related strategies
Comment
All comments (0)
No data
- 1