Estratégia de negociação bidirecional baseada no indicador MACD

Visão geral
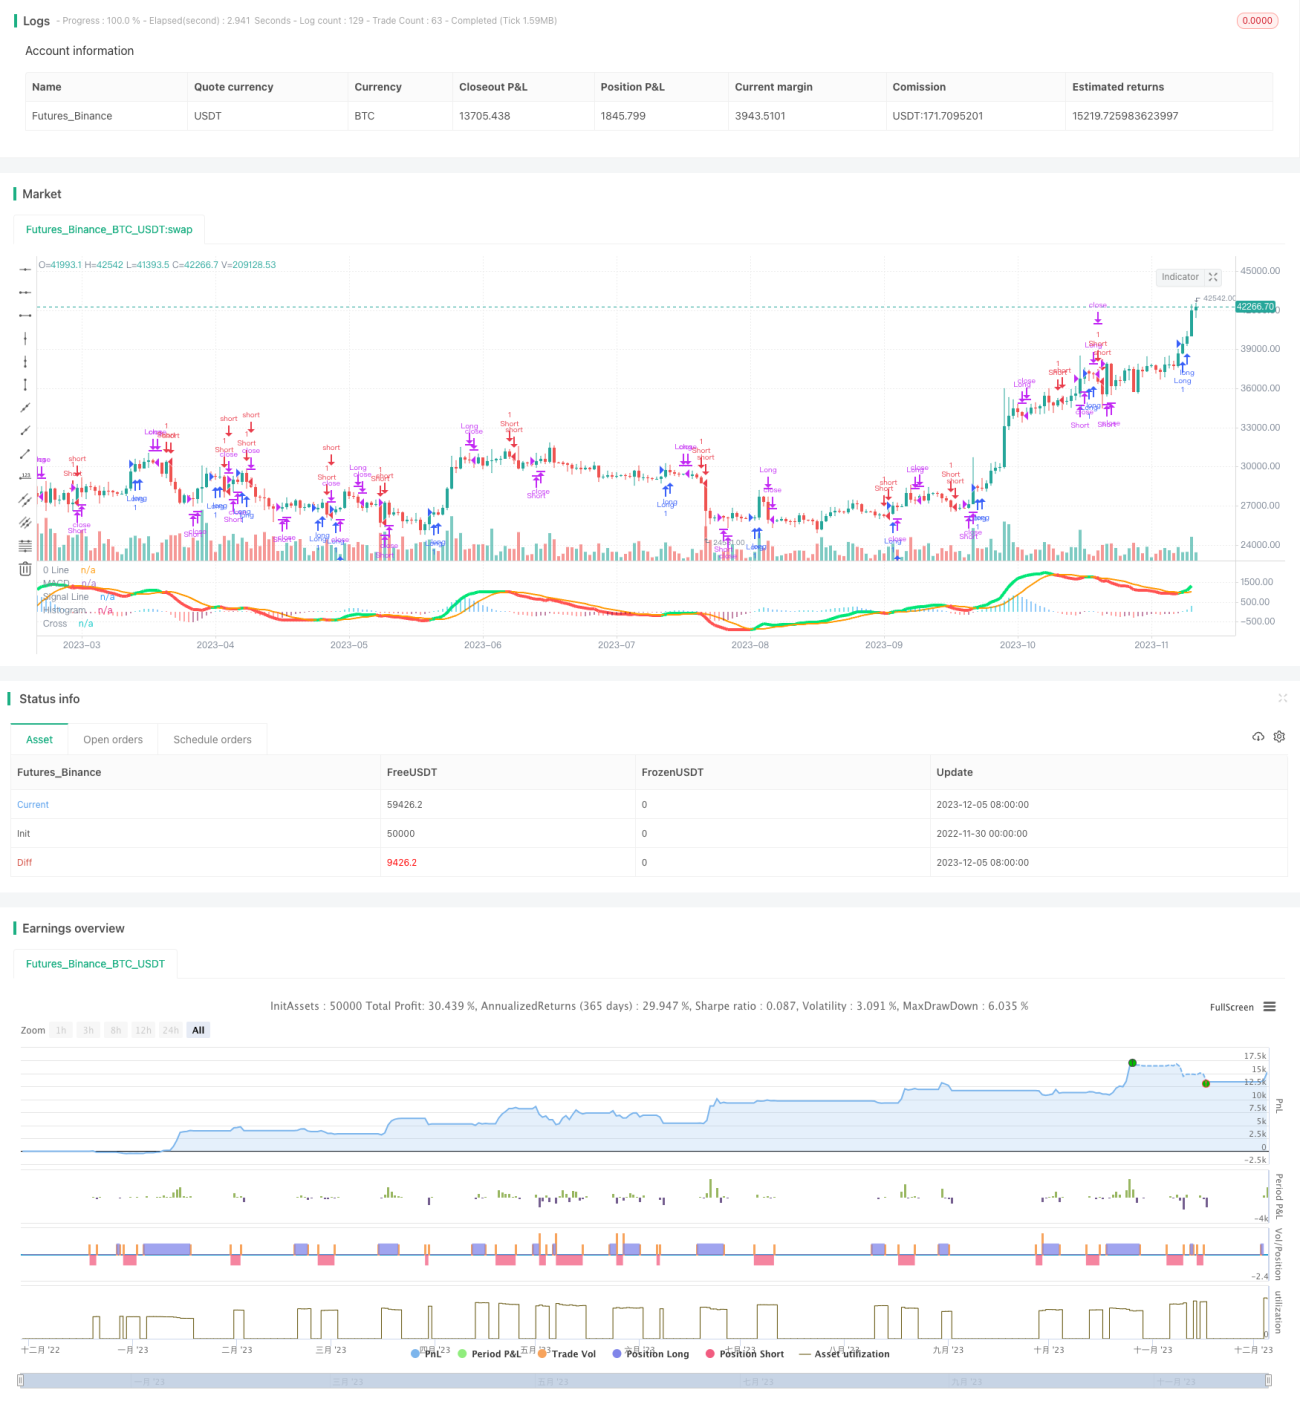
A estratégia baseia-se no MACD para implementar uma estratégia de negociação bidirecional. Ela pode fazer ativos e ativos no MACD quando o indicador está em alta e baixa, respectivamente, e combinar com outros indicadores para filtrar alguns sinais.
Princípio da estratégia
A estratégia utiliza principalmente o indicador MACD para realizar negociações bidirecionais. Concretamente, ele calcula a média móvel rápida, a média móvel lenta e a linha de sinal MACD. Gera um sinal de golden fork quando atravessa a média móvel lenta acima da média móvel rápida e gera um sinal de dead fork quando atravessa a média móvel lenta abaixo da média móvel rápida.
A fim de filtrar alguns sinais inválidos, a estratégia também configura um intervalo de ± 30 como filtro, que aciona o sinal de negociação somente quando a linha MACD está além desse intervalo. Além disso, a direção da linha MACD é determinada quando a posição está em equilíbrio, apenas quando a direção de duas colunas consecutivas muda.
Vantagens estratégicas
- Usando o MACD como principal sinal de negociação, que é mais sensível ao mercado de ações bidirecional
- Adição de filtros para filtrar sinais não válidos
- A lógica de equilíbrio de dois pilares consecutivos permite evitar false breakouts até certo ponto
Risco estratégico
- Os indicadores MACD são propensos a produzir sinais de negociação frequentes, o que pode levar a uma frequência de negociação excessiva
- Estratégia de um único indicador, um pequeno atraso no sinal pode causar prejuízos
- A lógica de equilíbrio para determinar a direção da linha em coluna não é rigorosa o suficiente, podendo haver risco de perda de sinal
Direção de otimização da estratégia
- Pode-se considerar a combinação de outros indicadores para confirmar o sinal, como o indicador KDJ, o indicador Brin e outros
- Outros indicadores mais avançados podem ser estudados para substituir os indicadores MACD, como o indicador KD
- Pode-se otimizar a lógica de liquidação, com paradas e paradas para controlar perdas individuais
Resumir
Em geral, esta estratégia é uma estratégia de negociação bidirecional básica. Ela aproveita os benefícios do indicador MACD e, ao mesmo tempo, adiciona um filtro para controlar a qualidade do sinal. Mas o indicador MACD em si também tem alguns problemas e ainda precisa de mais testes e otimização no mercado real para tornar a estratégia mais confiável.
]
/*backtest
start: 2022-11-30 00:00:00
end: 2023-12-06 00:00:00
period: 1d
basePeriod: 1h
exchanges: [{"eid":"Futures_Binance","currency":"BTC_USDT"}]
*/

//@version=3

//Created by user ChrisMoody updated 4-10-2014
//Regular MACD Indicator with Histogram that plots 4 Colors Based on Direction Above and Below the Zero Line- 1