Estratégia de negociação de porcentagem de bandas de Bollinger

Visão geral
A estratégia baseia-se no indicador da faixa de Brin, combinado com a média móvel e o indicador técnico ATR, para realizar um sistema de ruptura de curto período. A estratégia determina o excesso de compra e venda de preços através da contagem da porcentagem de posição relativa dos preços dentro do canal da faixa de Brin para gerar um sinal de negociação combinado com novas rupturas de alta e baixa.
Princípio da estratégia
- Calcular o percentual de posicionamento do preço dentro do canal e da faixa de Brin
- As médias móveis são calculadas em relação ao preço de abertura, ao preço de fechamento, ao preço máximo e ao preço mínimo.
- Calcular o indicador ATR e, em combinação com o ATR, definir a linha de stop loss
- Determinar se o preço está perto de um novo máximo ou de um novo mínimo
- A partir de preços máximos e mínimos anuais, a avaliação dos preços em grande escala
- Aperfeiçoamento de sinais de negociação através da variação de percentual da faixa de Brin e de novos altos e baixos
A estratégia usa o canal de Brin para determinar a volatilidade do mercado, a largura do canal de Brin é determinada pelo desvio padrão. O preço é o ponto de compra quando o Brin se desvia do trajeto abaixo do trajeto e o preço é o ponto de venda quando o Brin se eleva. A média móvel pode suavizar a oscilação do Brin e reduzir as falsas rupturas. O indicador ATR é combinado com a linha de parada móvel e a paralisação fixa.
Vantagens estratégicas
- O rigoroso julgamento da brecha na faixa de Brin reduz os sinais falsos.
- As médias móveis suavizam os preços para identificar tendências reais
- ATR indicador de tracking de stop loss dinâmico, para limitar perdas individuais
- Novos altos e baixos e julgamentos anuais de altos e baixos tornam os sinais mais confiáveis
- Combinação eficaz de vários indicadores tecnológicos para melhorar a eficiência da estratégia
Riscos estratégicos e soluções
- A configuração inadequada dos parâmetros de passagem da faixa de Brin pode levar a um excesso de false breakouts, e diferentes combinações de parâmetros devem ser testadas para obter o melhor resultado.
- Os preços de fechamento podem ser usados como uma linha de referência para um retorno acima do limite de perda definido pelo ATR, e pode ser considerado o uso de um maior margem de variação para calcular a porcentagem de preços mais baixos
- A rigidez do Brin pode perder oportunidades de tendência em linhas mais longas, sendo apropriado relaxar as condições de filtragem e o tempo de detenção.
- Os indicadores ATR são mais lentos para acompanhar grandes flutuações de preços, e devem ser considerados os indicadores de taxa de flutuação de maior frequência, como a amplitude real
- Os novos altos e baixos são susceptíveis de serem perturbados pelo ruído de curto prazo, devendo ser avaliados a significância estatística e a sustentabilidade da tendência
Direção de otimização da estratégia
- Teste diferentes combinações de parâmetros para determinar o melhor parâmetro de faixa de Bryn e comprimento de média móvel
- Combinação de modelos combinados com diferentes parâmetros de banda de Bryn ou média móvel para julgar o sinal
- Teste de adaptabilidade a diferentes períodos de tempo e diferentes variedades de parâmetros, aumentando a robustez
- Combinação de mais critérios de grande escala, como o sinal de faixa de Brin em nível de linha solar ou fatores sazonais
- Avaliação de oportunidades de acompanhamento de tendências para expandir a cobertura estratégica e a margem de lucro
Resumir
A estratégia utiliza vários instrumentos técnicos, como percentual de Brin, média móvel, indicadores ATR, novos altos, novos baixos e altos e baixos anuais, para construir uma estratégia de negociação de ruptura relativamente rigorosa e eficiente em períodos curtos. Sua vantagem destacada é o uso de vários tipos de ferramentas para reduzir o ruído e identificar sinais de tendência reais.
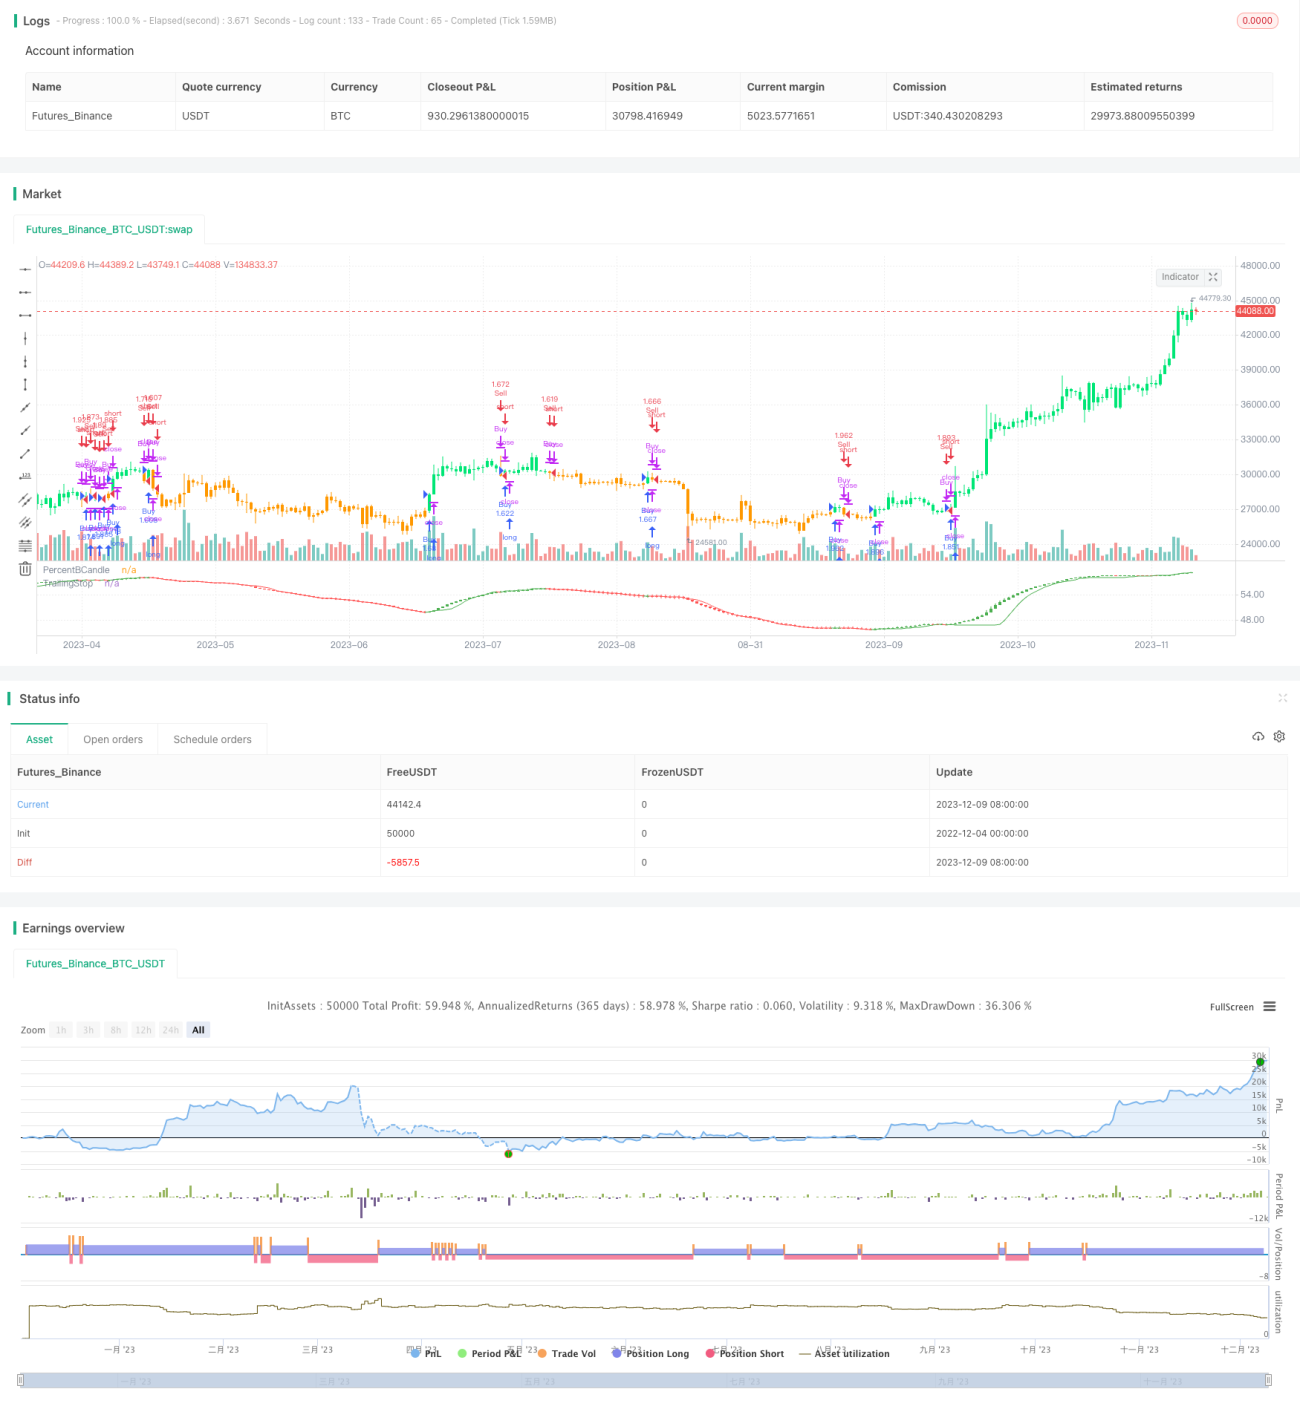
/*backtest
start: 2022-12-04 00:00:00
end: 2023-12-10 00:00:00
period: 1d
basePeriod: 1h
exchanges: [{"eid":"Futures_Binance","currency":"BTC_USDT"}]
*/

// This source code is subject to the terms of the Mozilla Public License 2.0 at https://mozilla.org/MPL/2.0/
// © HeWhoMustNotBeNamed

//@version=4- 1