Estratégia de Stop Loss de Super Tendência

Visão geral
A estratégia baseia-se em indicadores de tendência ultrapassada e tracking stop loss para abrir posições de paz. Ela usa 4 alarmes para abrir posições de paz e adota uma estratégia de tendência ultrapassada. A estratégia é projetada especificamente para robôs e possui função de tracking stop loss.
Princípio da estratégia
A estratégia usa o indicador ATR para calcular o alerta e o alerta. Quando o preço de fechamento quebra o alerta, gera um sinal de compra. Quando o preço de fechamento quebra o alerta, gera um sinal de venda. A estratégia também usa uma linha de tendência para determinar a direção da tendência.
Análise de vantagens
A estratégia combina os benefícios do indicador de ultra-trend para determinar a direção da tendência e do indicador ATR para definir o stop loss, permitindo filtrar efetivamente as brechas falsas. O tracking stop loss pode ser muito bom para bloquear o lucro e reduzir a retração. Além disso, a estratégia é projetada especificamente para robôs e pode automatizar as negociações.
Análise de Riscos
Os indicadores de tendência ultra tendem a gerar mais sinais errados. Quando o preço de parada é ajustado em grande medida, aumenta a probabilidade de o stop-loss ser batido. Além disso, o robô de negociação também enfrenta riscos técnicos, como falha do servidor e interrupção da rede.
Para reduzir a probabilidade de sinais errados, pode-se ajustar adequadamente os parâmetros do ATR ou adicionar outros indicadores para filtragem. O ajuste da amplitude de rastreamento de stop loss requer um equilíbrio entre lucro e risco. Ao mesmo tempo, prepare servidores e redes de reserva para evitar o risco de falhas técnicas.
Direção de otimização
A estratégia pode ser melhorada em alguns aspectos:
-
Adicionar indicadores ou condições para filtrar o sinal de entrada e evitar sinais falsos. Por exemplo, pode ser adicionado um indicador MACD.
-
É possível testar diferentes combinações de parâmetros ATR para encontrar o melhor parâmetro.
-
Otimizar a amplitude de rastreamento de stop loss para encontrar o melhor ponto de equilíbrio.
-
Pode-se adicionar mais preços de stop loss para conseguir um stop loss por lotes.
-
Pode-se criar uma arquitetura de servidor duplo de reserva principal, com a capacidade de alternar rapidamente em caso de falha do servidor principal.
Resumir
Esta estratégia integra os benefícios dos indicadores de ultra-trend e do rastreamento de stop loss para automatizar a abertura e o stop loss. As melhorias na direção da otimização em conjunto com o setor físico podem ser uma estratégia de negociação quantitativa muito prática.
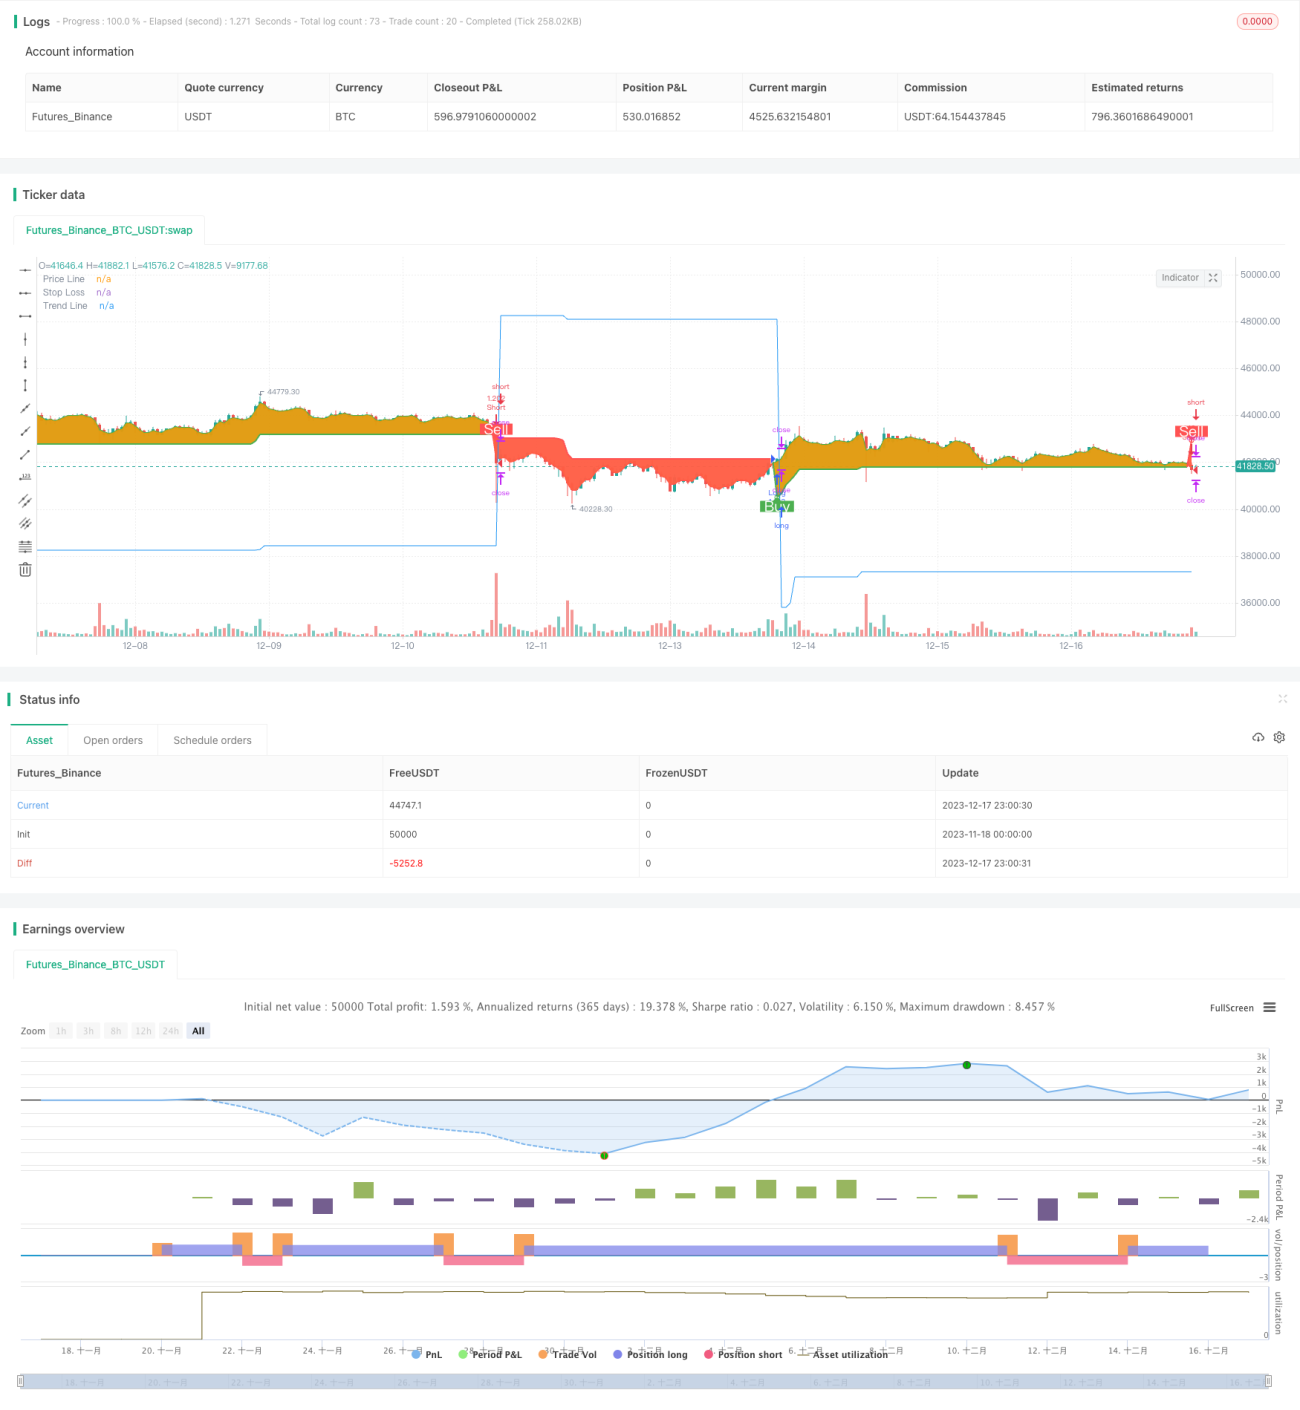
/*backtest
start: 2023-11-18 00:00:00
end: 2023-12-18 00:00:00
period: 1h
basePeriod: 15m
exchanges: [{"eid":"Futures_Binance","currency":"BTC_USDT"}]
*/

// This source code is subject to the terms of the Mozilla Public License 2.0 at https://mozilla.org/MPL/2.0/
// © arminomid1375
//@version=5
strategy('Mizar_BOT_super trend', overlay=true, default_qty_value=100, currency=currency.USD, default_qty_type=strategy.percent_of_equity, initial_capital=100, max_bars_back=4000)- 1