Indicador excelente de volatilidade do oscilador estratégia de negociação

Visão geral
A estratégia de negociação de indicadores de otimismo de oscilação é uma estratégia de negociação quantitativa desenvolvida com base nas recomendações de Bill Williams em seu livro The New Trading Dimension Array. A estratégia utiliza o diferencial de médias móveis rápidas e médias móveis lentas para construir indicadores de oscilação, e é exibida na forma de gráficos em coluna, emitindo sinais de negociação através da mudança de cor do gráfico em coluna.
Princípio da estratégia
O indicador central da estratégia é o indicador de excelência de oscilação de tremor (Awesome Oscillator, AO), cuja fórmula de cálculo é:
AO = SMA(Median Price, Fast Length) - SMA(Median Price, Slow Length)
Dentre eles, o preço médio toma a média entre o preço alto e o preço baixo; o comprimento rápido representa o comprimento do ciclo da média móvel rápida; o comprimento lento representa o comprimento do ciclo da média móvel lenta.
O indicador AO reflete a oscilação dos preços de mercado em diferentes escalas de tempo através da diferença entre as médias móveis rápidas e lentas. Quando a média móvel rápida é maior do que a média móvel lenta, representa uma força de preço de curto prazo mais forte do que a força de preço de longo prazo, como um sinal de compra; Quando a média móvel rápida é menor do que a média móvel lenta, representa uma força de preço de curto prazo mais fraca do que a força de preço de longo prazo, como um sinal de venda.
A estratégia usa o valor atual do indicador AO com o diferencial do período anterior para determinar o estado de vazio do período atual e é marcada por cores diferentes no gráfico em coluna: o valor atual do AO maior que o período anterior é marcado em azul, indicando a compra; o AO menor que o período anterior é marcado em vermelho, indicando a venda.
Análise de vantagens
A estratégia tem as seguintes vantagens:
- O uso de médias móveis para a construção de indicadores, para suavizar os dados de preços e ajudar a filtrar o ruído do mercado;
- Diferenças entre a média rápida e a média lenta, para captar as mudanças de tendências de preços no mercado em diferentes escalas de tempo;
- O gráfico em forma de coluna mostra intuitivamente o estado de vazio, facilitando a determinação da direção do negócio;
- Parâmetros personalizáveis ajustam a sensibilidade do indicador para diferentes variedades de negociação.
Análise de Riscos
A estratégia também traz alguns riscos:
- A configuração inadequada dos parâmetros pode levar a sinais de negociação frequentes, resultando em excesso de negociação;
- A construção do indicador de choque é relativamente complexa e os parâmetros impróprios podem perder oportunidades de negociação;
- A fonte pontual é única e pode ser melhorada por meio da combinação de outros indicadores.
Para reduzir os riscos acima, pode-se otimizar a configuração dos parâmetros, ajustar a construção dos indicadores e verificar com outros indicadores.
Direção de otimização
A estratégia pode ser melhorada em vários aspectos:
- Optimizar os parâmetros de comprimento das linhas médias rápida e lenta para encontrar a melhor combinação de parâmetros;
- Tente construir outros tipos de médias móveis de indicadores AO, como EMA, LWMA, etc.
- Combinação de indicadores de tendência e oscilação para melhorar a eficácia dos indicadores;
- Aumentar o mecanismo de suspensão de perdas para controlar as perdas individuais.
Resumir
Em suma, a estratégia de negociação de indicadores de otimização de oscilação de oscilação usa o diferencial de média móvel rápida e lenta para determinar a mudança de tendência de preços e detectar efetivamente oportunidades de reversão em curto prazo. A estratégia é clara e fácil de implementar, e espera-se obter melhores resultados de negociação por meio de otimização de parâmetros e combinação com outros indicadores.
/*backtest
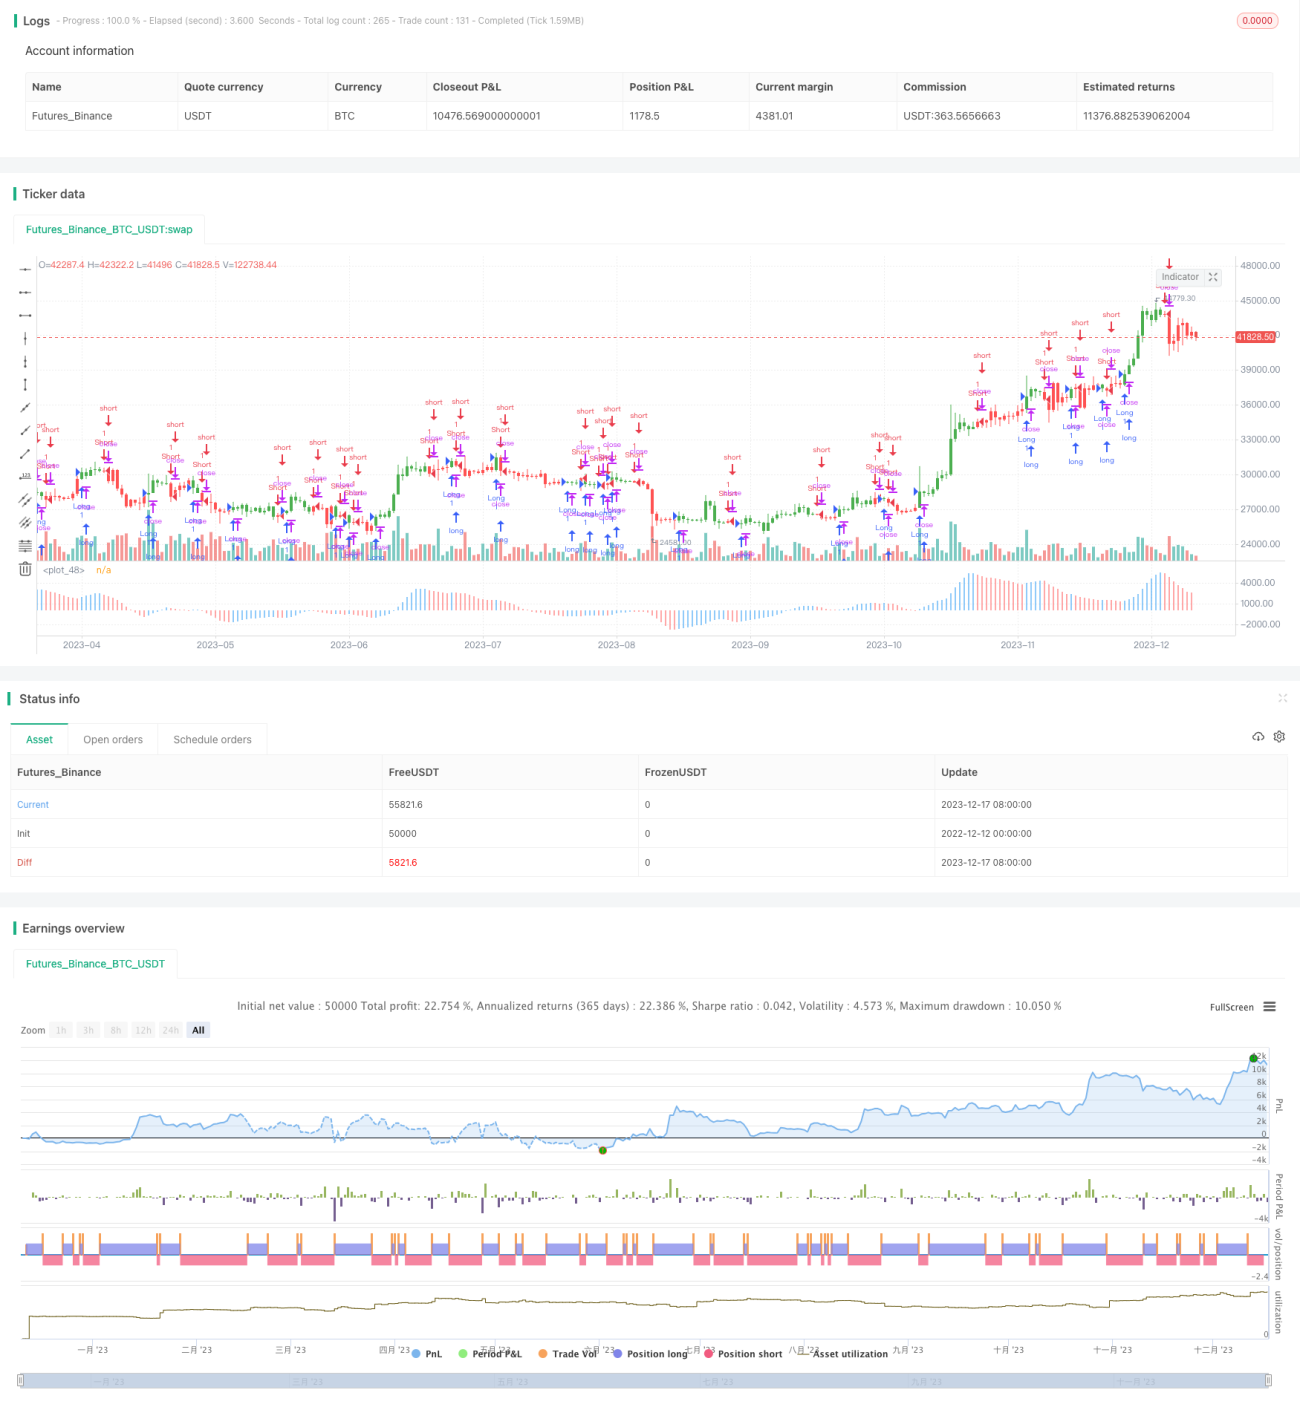
start: 2022-12-12 00:00:00
end: 2023-12-18 00:00:00
period: 1d
basePeriod: 1h
exchanges: [{"eid":"Futures_Binance","currency":"BTC_USDT"}]
*/
//@version=2
////////////////////////////////////////////////////////////
// Copyright by HPotter v1.0 29/12/2016
// This indicator is based on Bill Williams` recommendations from his book - 1