Estratégia de negociação de rompimento de momentum

Visão geral
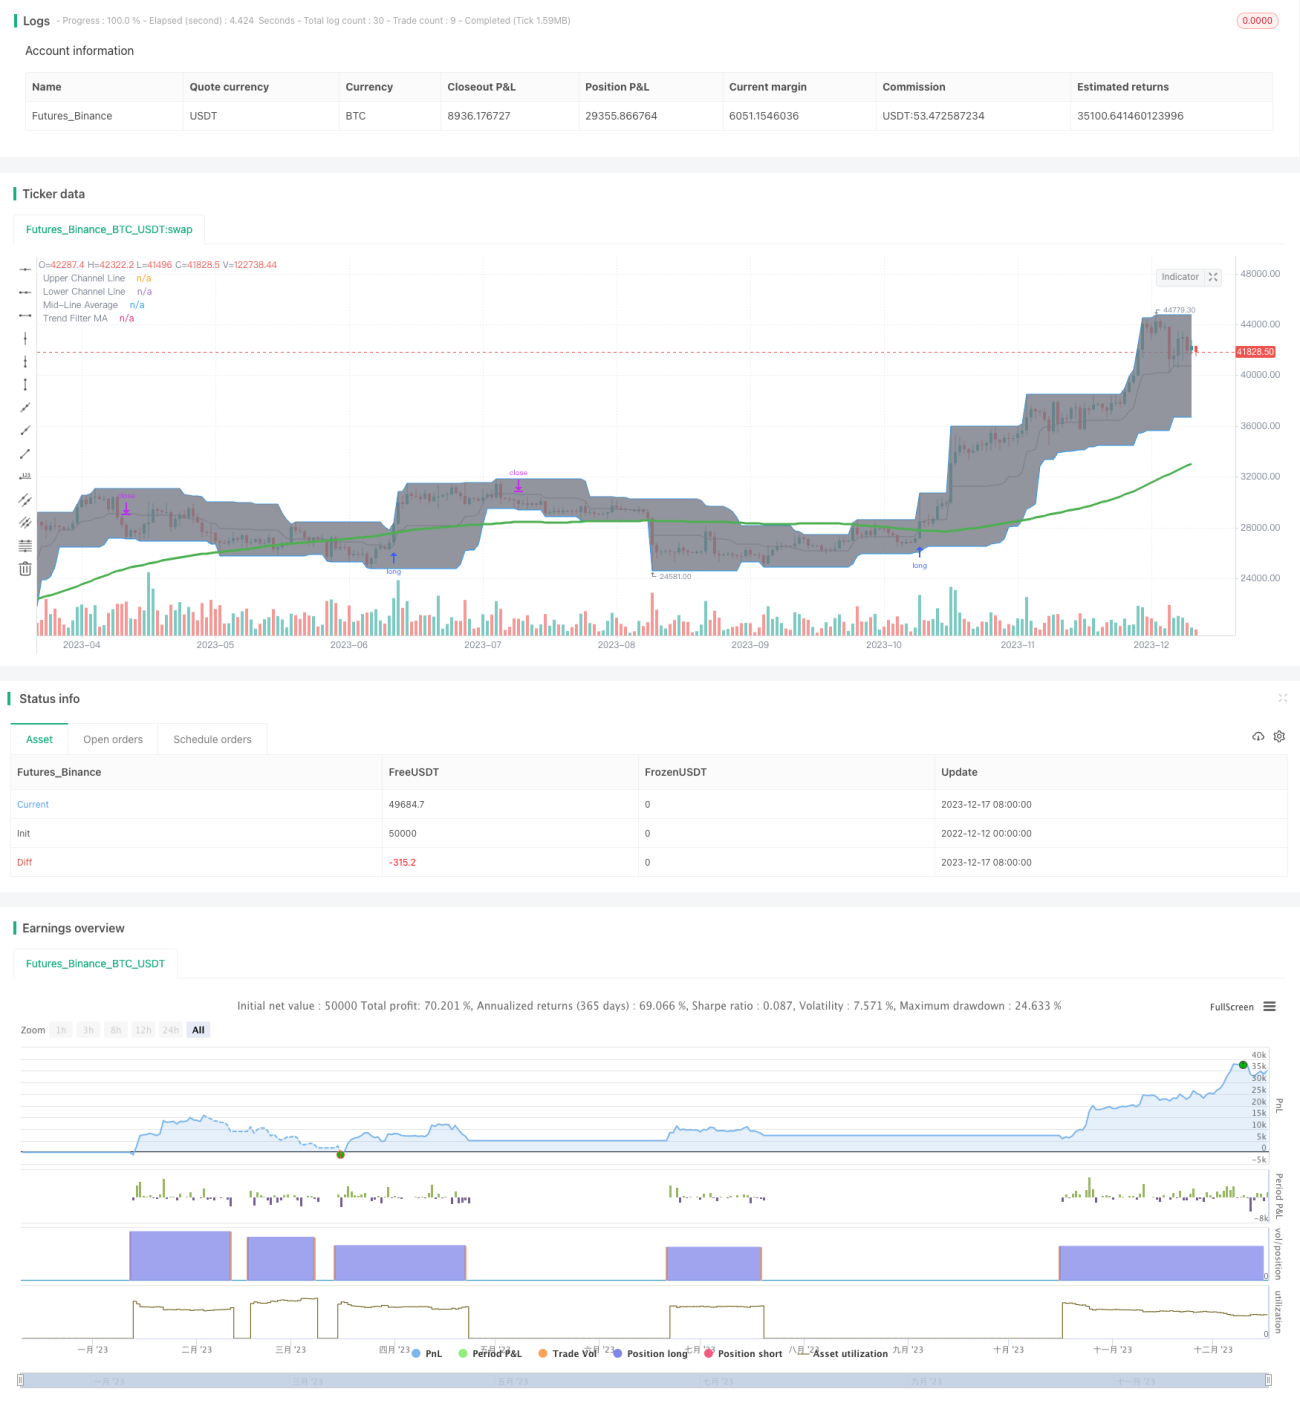
A estratégia de negociação de ruptura de momento é uma estratégia de rastreamento de tendências que gera um sinal de negociação detectando que o preço quebra o ponto de resistência de suporte crítico. A estratégia usa a dinâmica do indicador do canal de Donchian para determinar o ponto de resistência de suporte crítico e, em combinação com o indicador de média móvel, filtra ainda mais os sinais para evitar transações erradas.
Princípio da estratégia
O indicador central da estratégia é o Canal Donchian. O Canal Donchian é composto por preços máximos, mínimos e médios. As linhas de trajectória superior e inferior conectam respectivamente os preços máximos e mínimos de um determinado período.
As médias móveis são usadas para determinar a direção da tendência dos preços. Os sinais de compra de ruptura de canais são adotados somente quando os preços estão acima das médias móveis, evitando assim a compra de áreas de correção.
Especificamente, a entrada para a estratégia é: o preço quebra o trajeto ascendente do Donchian Channel e o preço de fechamento é superior à média móvel. A saída é: o preço cai abaixo do trajeto descendente do Donchian Channel.
O modo de stop loss é o de seguir o traçado do canal Donchian. Isso garante que o ponto de stop loss suba com a tendência.
Análise de vantagens
A estratégia combina dois indicadores para determinar a direção e a intensidade da tendência, permitindo identificar sinais de ruptura e evitar erros de negociação. Ao mesmo tempo, o método de parada de perda é razoável, permitindo que a estratégia acompanhe adequadamente a tendência para obter lucro.
Em particular, a estratégia tem as seguintes vantagens:
-
O indicador de canal de Donchian pode determinar de forma dinâmica os pontos críticos de resistência de suporte e identificar os pontos críticos de reversão da tendência.
-
O indicador de média móvel serve como um filtro para evitar compras em áreas de compensação e reduzir a transação inválida.
-
A forma de parar a perda é seguir o traçado do canal Donchian, para maximizar o lucro da tendência.
-
A configuração dos parâmetros da estratégia é razoavelmente flexível e pode ser adaptada e otimizada para diferentes condições de mercado.
Análise de Riscos
A estratégia tem como principais riscos:
-
Risco de fracasso de ruptura. O preço pode ser rapidamente retraído após a ruptura do canal e não pode ser efetivamente armazenado.
-
Risco de reversão de tendência. A reversão de tendência pode ocorrer antes do ponto de parada, resultando em uma parada de perda.
-
Risco de otimização de parâmetros. A configuração inadequada de parâmetros pode causar frequência de negociação ou falta de sinais.
Para esses riscos, pode ser otimizado por meio do ajuste do ciclo da média móvel, o aumento da quantidade de transação de filtragem, etc., para garantir que o sinal produzido seja mais confiável. Ao mesmo tempo, deve ser adequadamente Loose algumas configurações de Stop Loss para lidar com o risco de ajustes de curto prazo.
Direção de otimização
A estratégia pode ser melhorada em alguns aspectos:
-
A utilização de um indicador de volume de tráfego para filtrar os sinais, assegurando que a brecha é forte.
-
Optimizar os parâmetros de média móvel para que eles sejam mais adequados às características de diferentes variedades.
-
Ajustar o mecanismo de parada para que a distância de parada possa se adaptar às flutuações de mercado.
-
Aumentar o mecanismo de reentrada para capturar novas oportunidades de tendência após a paralisação.
-
Retestamento de várias variedades, verificação de robustez dos parâmetros. Ajuste os parâmetros de acordo com as características de diferentes variedades.
Resumir
A estratégia de negociação de ruptura dinâmica integra vários indicadores para determinar a direção e a intensidade da tendência, resolvendo o problema da construção de posições cegas em sistemas de tendência comuns. A configuração de parâmetros da estratégia é flexível e pode ser ajustada de forma otimizada para diferentes situações e variedades de negociação.
- 1