Estratégia de negociação de curto prazo baseada no indicador de volatilidade de Chaikin
Visão geral
Esta estratégia baseia-se no índice de flutuação do tesouro, um sistema de negociação de linha curta projetado principalmente para capturar as flutuações de linha curta no mercado. A principal idéia da estratégia é comprar ou vender quando o índice de flutuação do tesouro atravessa ou despenca o limiar especificado.
Princípio da estratégia
O índice de flutuabilidade do Caixinha é uma medida quantitativa da flutuabilidade, calculada através do cálculo do intervalo entre os preços mais altos e mais baixos dos títulos. Quando o diferencial entre os preços mais altos e mais baixos se expande, a flutuabilidade aumenta.
A lógica da estratégia é a seguinte:
- Calcular o índice de volatilidade do ouro-molibdênio (xROC_EMA)
- Configurar um Trigger
- Quando o xROC_EMA está acima do Trigger, faça mais; quando o xROC_EMA está abaixo do Trigger, faça vazio
- Pode optar por inverter a negociação
Análise de vantagens estratégicas
A estratégia tem as seguintes vantagens:
- Responsável e adequado para operações de linha curta
- Retiradas relativamente pequenas, com algum efeito de gestão de fundos
- Simples e fácil de entender
- Parâmetros podem ser ajustados de forma flexível para se adaptar a diferentes cenários de mercado
Análise de Riscos
A estratégia também apresenta alguns riscos:
- A frequência de transações em linhas curtas é elevada e existe o risco de transações excessivas.
- Parâmetros de configuração, como o comprimento, o gatilho e outros, são facilmente ajustados.
- Perda de lucro com reversão de negócio
- Não é possível filtrar eficazmente o ruído do mercado, existindo uma certa probabilidade de transações erradas
A solução para o risco é a seguinte:
- Ajustar os parâmetros adequadamente para controlar a frequência de transação
- Optimizar a configuração dos parâmetros para evitar sobreajustes
- Um parâmetro de redução de perdas apropriado, dando uma certa margem de manobra para o preço
- Filtragem em combinação com outros indicadores para reduzir erros de negociação
Direção de otimização da estratégia
Esta estratégia pode ser melhorada em:
- Indicadores de estrutura de mercado, identificação de tendências e posições de apoio-chave
- Aumentar as condições de filtragem e reduzir o whipsaw, por exemplo, adicionando indicadores de quantidade de energia, médias móveis, etc.
- Parâmetros de ajuste dinâmico que permitem variação de acordo com as mudanças no ambiente de mercado
- Otimização de mecanismos de stop loss, como o uso de tracking stop loss ou Chandelier Exit, para bloquear mais lucros
Resumir
O conceito geral da estratégia é claro e simples, com características de manipulação de linhas curtas. A configuração de parâmetros é flexível e pode ser ajustada conforme necessário.
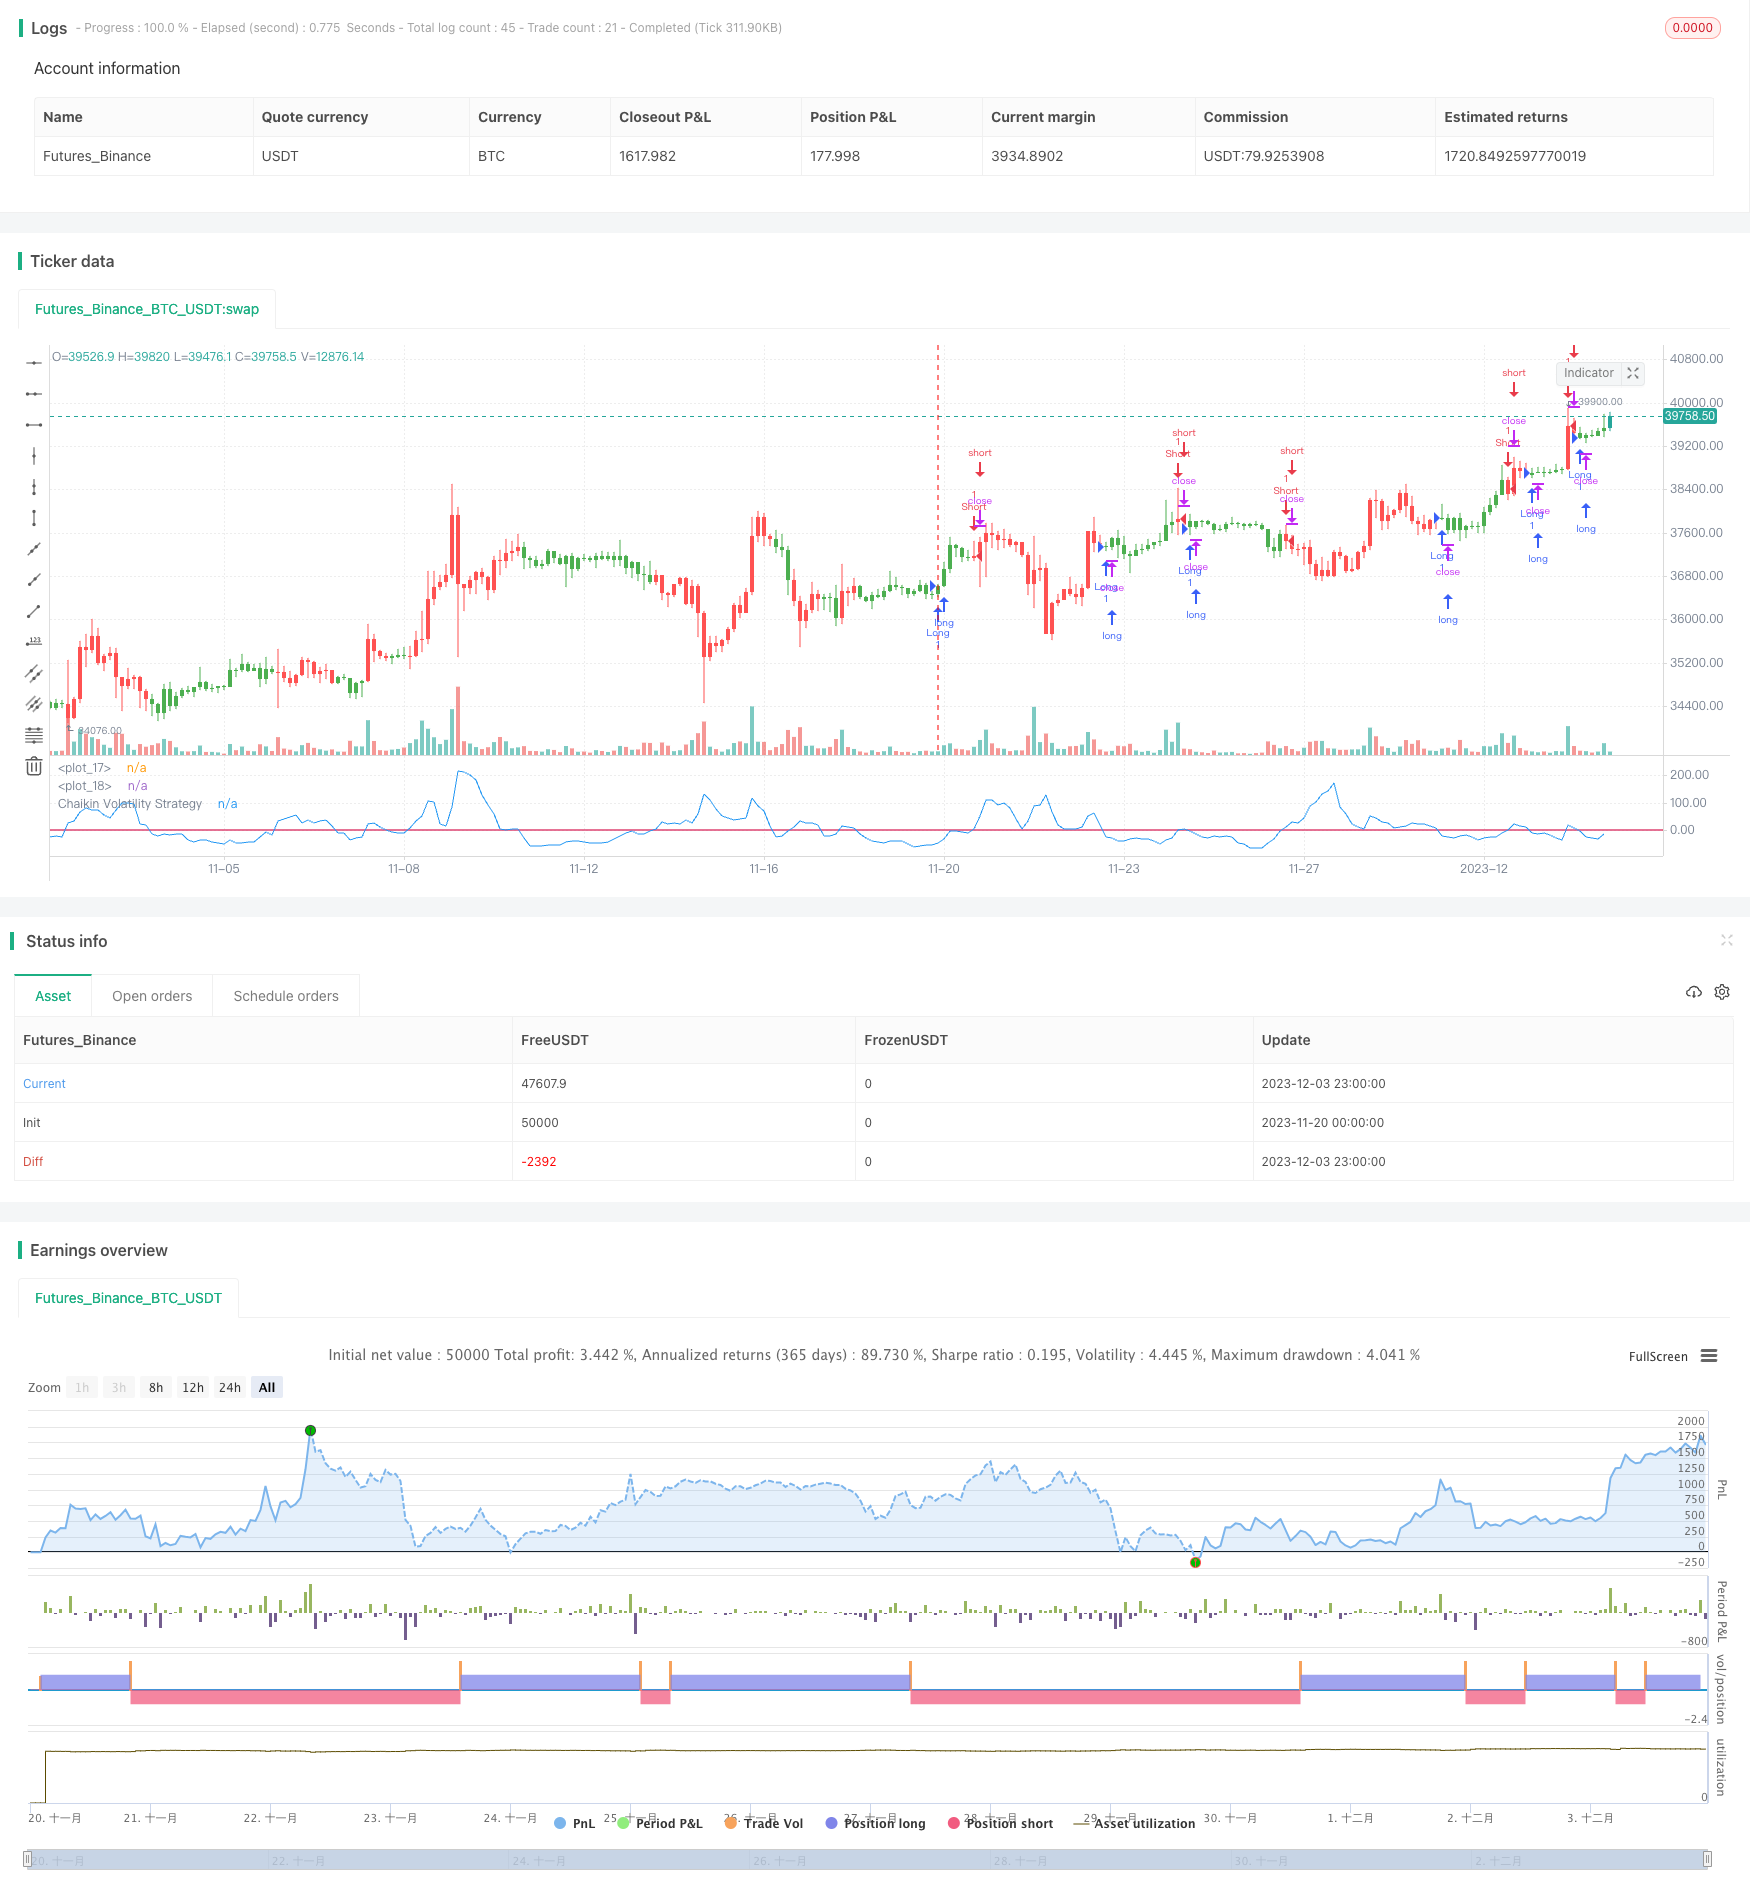
/*backtest
start: 2023-11-20 00:00:00
end: 2023-12-04 00:00:00
period: 3h
basePeriod: 15m
exchanges: [{"eid":"Futures_Binance","currency":"BTC_USDT"}]
*/

//@version = 2
////////////////////////////////////////////////////////////
//  Copyright by HPotter v1.0 01/12/2016
// Chaikin's Volatility indicator compares the spread between a security's
// high and low prices. It quantifies volatility as a widening of the range
// between the high and the low price.
// You can use in the xPrice1 and xPrice2 any series: Open, High, Low, Close, HL2,
// HLC3, OHLC4 and ect...
// You can change long to short in the Input Settings
// Please, use it only for learning or paper trading. Do not for real trading.
///////////////////////////////////////////////////////////
strategy(title="Chaikin Volatility Strategy Backtest")
Length = input(10, minval=1)
ROCLength = input(12, minval=1)
Trigger = input(0, minval=1)
reverse = input(false, title="Trade reverse")
hline(0, color=purple, linestyle=line)
hline(Trigger, color=red, linestyle=line)
xPrice1 = high
xPrice2 = low
xPrice = xPrice1 - xPrice2
xROC_EMA = roc(ema(xPrice, Length), ROCLength)
pos = iff(xROC_EMA < Trigger, 1,
	   iff(xROC_EMA > Trigger, -1, nz(pos[1], 0)))
possig = iff(reverse and pos == 1, -1,
         iff(reverse and pos == -1, 1, pos))
if (possig == 1)
    strategy.entry("Long", strategy.long)
if (possig == -1)
    strategy.entry("Short", strategy.short)
barcolor(pos == -1 ? red: pos == 1 ? green : blue )
plot(xROC_EMA, color=blue, title="Chaikin Volatility Strategy")