Estratégia de robô escalável HTF MACD MFI sem repintura personalizada
Visão geral
A estratégia é uma estratégia de combinação de indicadores MACD e MFI altamente personalizáveis e não redesenhados para robôs de negociação algorítmicos. Combina indicadores de tendência e indicadores de momentum para gerar sinais de negociação através de vários filtros.
Princípio da estratégia
A estratégia usa o MACD para determinar a direção da tendência do mercado. O MACD é um indicador de movimento de tendência, que é obtido pela média móvel rápida, menos a média móvel lenta, obtendo o gráfico em forma de coluna do MACD, e a média móvel indexada do MACD obtendo a linha de sinal.
Além disso, a estratégia também usa o indicador MFI para avaliar o estado de sobrevenda do mercado. O indicador MFI combina informações sobre preços e volume de transação, oscilando entre 0 e 100. O MFI abaixo de 20 é a zona de sobrevenda e acima de 80 é a zona de sobrevenda.
Para filtrar falsos sinais, a estratégia também adiciona filtros de tendência e filtros RSI. Quando o preço está em uma tendência ascendente e o RSI é menor do que o limiar definido, um sinal de compra é gerado.
Vantagens estratégicas
- Combinando vários indicadores, compreendendo o estado do mercado, aumentando a taxa de vitória
- A adição de mecanismos de filtragem evita sinais falsos e reduz transações desnecessárias
- Os parâmetros e filtros podem ser configurados de forma personalizada para diferentes variedades e preferências de negociação
- Pode ser usado para transações manuais ou pode ser conectado a robôs algorítmicos para transações programadas
Riscos estratégicos e soluções
Parâmetros de indicadores mal definidos são propensos a produzir falsos sinais
Teste diferentes parâmetros para escolher a melhor combinação
Parâmetros multivariados não são usados e precisam ser testados e otimizados separadamente
A frequência de transações pode ser excessiva, aumentando os custos de transação e o risco de deslizamento
Filtros ajustáveis para reduzir a frequência de transação
Controle de custos em transações físicas
Direção de otimização da estratégia
- Teste com um ciclo de dados mais longo para avaliar a estabilidade dos parâmetros
- Tente diferentes combinações de parâmetros de indicadores
- Optimizar o peso dos indicadores e aumentar a estabilidade da estratégia
- Adicionar mais filtros para reduzir transações desnecessárias
Resumir
A estratégia é uma estratégia de seguimento de tendências altamente personalizável, combinando tendências e indicadores de dinâmica para avaliar o estado do mercado e usar efetivamente o mecanismo de filtragem para controlar o risco. Ela pode ser usada para negociações manuais, mas também pode ser conectada a robôs algorítmicos para realizar negociações programadas com alto grau de automação, um sistema de estratégias que vale a pena acompanhar a longo prazo.
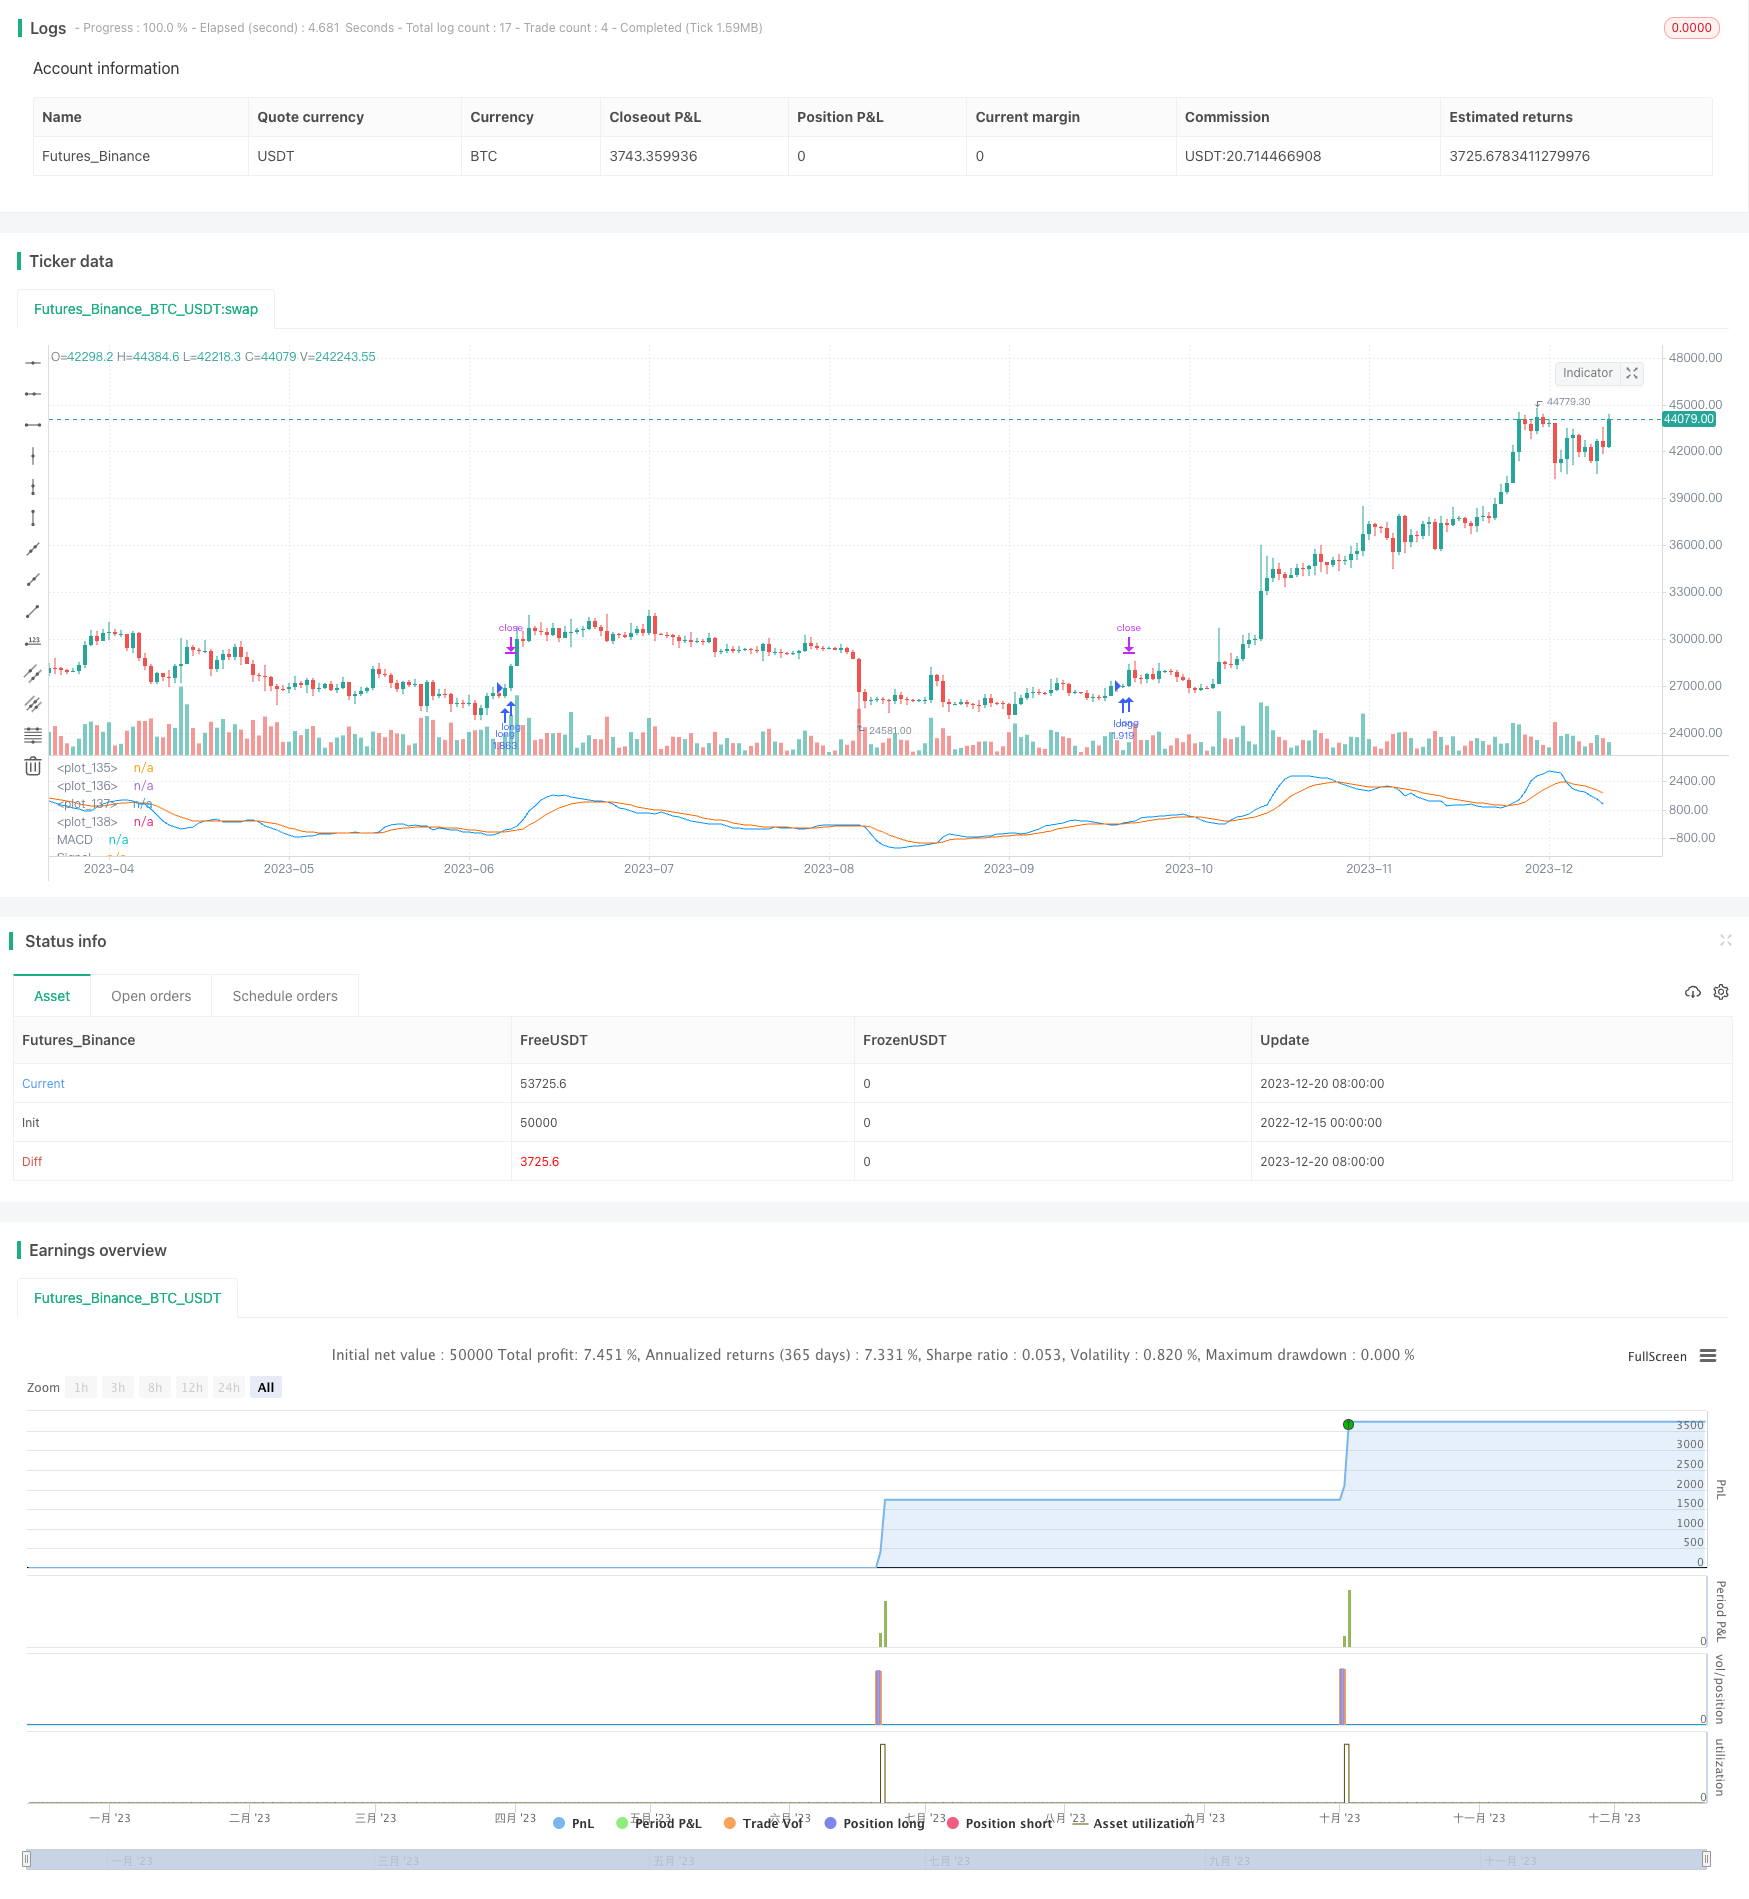
/*backtest
start: 2022-12-15 00:00:00
end: 2023-12-21 00:00:00
period: 1d
basePeriod: 1h
exchanges: [{"eid":"Futures_Binance","currency":"BTC_USDT"}]
*/

//(c) Wunderbit Trading
//Modified by Mauricio Zuniga - Trade at your own risk
//This script was originally shared on Wunderbit website as a free open source script for the community. (https://help.wundertrading.com/en/articles/5246468-macd-mfi-trading-bot-for-ftx)
//
//WHAT THIS SCRIPT DOES:
//   This is a scalping script originally intended to be used on altorightmic bot trading.
//   This strategy is based on the trend-following momentum indicator. It includes the Money Flow index as an additional point for entry.
//HOW IT DOES IT:
//   It uses a combination of MACD and MFI indicators to create entry signals.  Parameters for each indicator have been surfaced for user configurability.
//   Take profits are fixed, but stop loss uses ATR configuration to minimize losses and close profitably.
//HOW IS MY VERSION ORIGINAL:
//   I started trying to deploy this script myself in my algorithmic tradingg but ran into some issues which I have tried to address in this version.
//   Delayed Signals : The script has been refactored to use a time frame drop down.  The higher time frame can be run on a faster chart (recommended on one minute chart for fastest signal confirmation and relay to algotrading platform.
//   Repainting Issues : All indicators have been recoded to use the security function that checks to see if the current calculation is in realtime, if it is, then it uses the previous bar for calculation.
//   If you are still experiencing repainting issues based on intended (or non intended use), please provide a report with screenshot and explanation so I can try to address.
//   Filtering :  I have added to additional filters an ABOVE EMA Filter and a BELOW RSI Filter (both can be turned on and off)
//   Customizable Long and Clos Messages : This allows someone to use the script for algorithmic trading without having to alter code.  It also means you can use one indicator for all of your different alterts required for your bots.
//HOW TO USE IT:
//   Find a pair with high volatility - I have found it works particularly well with 3L and 3S tokens for crypto. although it the limitation is that confrigurations I have found to work typically have low R/R ratio, but very high win rate and profit factor.
//   Ieally set one minute chart for bots, but you can use other charts for manual trading.  The signal will be delayed by one bar but I have found configurations that still test well.
//   Select a time frame in configuration for your indicator calculations.
//   I like ot use 5 and 15 minutes for scalping scenarios, but I am interested in hearing back from other community memebers.
//   Optimize your indicator without filters (trendFilter and RSI Filter)
//   Use the TrendFilter and RSI Filter to further refine your signals for entry.

//@version=4
strategy("Customizable HTF MACD Strategy v1.2", overlay=false, pyramiding=0, commission_type=strategy.commission.percent, commission_value=0.07, default_qty_type = strategy.percent_of_equity, default_qty_value = 100, currency = currency.USD)

openlongcomment = "Comment In Here"
closelongcomment = ""
openshortcomment = ""
closeshortcommment = ""
//RES
res = input(title="Resolution", type=input.resolution, defval="5", group="Strategy", inline="1")
comment = input(title="Open Long Comment", type=input.string, defval="",group="Strategy", inline="1")

if not(comment == "")
    openlongcomment := comment
// FUNCTIONS

Ema(src,p) =>
    ema = 0.
    sf = 2/(p+1)
    ema := nz(ema[1] + sf*(src - ema[1]),src)

Sma(src,p) => a = cum(src), (a - a[max(p,0)])/max(p,0)

Atr(p, res) =>
    atr = 0.
    highHTF = security(syminfo.tickerid, res, high[barstate.isrealtime ? 1 : 0])
    lowHTF = security(syminfo.tickerid, res, low[barstate.isrealtime ? 1 : 0])
    closeHTF = security(syminfo.tickerid, res, close[barstate.isrealtime ? 1 : 0])
    Tr = max(highHTF - lowHTF, max(abs(highHTF - closeHTF[1]), abs(lowHTF - closeHTF[1])))
    atr := nz(atr[1] + (Tr - atr[1])/p,Tr)


ribbon_period = input(39, "Period", step=1)

htfClose = security(syminfo.tickerid, res, close[barstate.isrealtime ? 1 : 0])

leadLine1 = ema(htfClose, ribbon_period)
leadLine2 = sma(htfClose, ribbon_period)

// p3 = plot(leadLine1, color= #53b987, title="EMA", transp = 50, linewidth = 1)
// p4 = plot(leadLine2, color= #eb4d5c, title="SMA", transp = 50, linewidth = 1)
// fill(p3, p4, transp = 60, color = leadLine1 > leadLine2 ? #53b987 : #eb4d5c)

//Upward Trend
UT=leadLine2 < leadLine1
DT=leadLine2>leadLine1
//FILTER LOGIC
aboveTrend = input(true, title="Use Trend", group="Filters", inline='1', type=input.bool)
TrendLength  = input(3, minval=1, title="Trend MA", group="Filters", inline='1', type=input.integer)
aboveTrendFilter = sma(htfClose,TrendLength)

useRSI = input(true, title="Use RSI", group="Filters", inline='2', type=input.bool)
RSILength  = input(34, minval=1, title="RSI Length", group="Filters", inline='2') // used to calculate RSI
belowRSIFilter  = input(50, minval=1, title="Buy Below RSI Filter", group="Filters", inline='2') // only buy if its below this RSI - doesn't seem to work as expected
rsi = rsi(htfClose,RSILength)

if not(useRSI)
    belowRSIFilter = 100
if not(aboveTrend)
    aboveTrendFilter = -1


// MACD
fast_length = input(title="Fast Length", type=input.integer, defval=7)
slow_length = input(title="Slow Length", type=input.integer, defval=23)
src = input(title="Source", type=input.source, defval=close)
signal_length = input(title="Signal Smoothing", type=input.integer, minval = 1, maxval = 50, defval = 10)
sma_source = input(title="Simple MA(Oscillator)", type=input.bool, defval=false)
sma_signal = input(title="Simple MA(Signal Line)", type=input.bool, defval=false)

// Plot colors
col_grow_above = #26A69A
col_grow_below = #FFCDD2
col_fall_above = #B2DFDB
col_fall_below = #EF5350
col_macd = #0094ff
col_signal = #ff6a00


srcHTF = security(syminfo.tickerid, res, src[barstate.isrealtime ? 1 : 0])
// Calculating
fast_ma = sma_source ? Sma(srcHTF, fast_length) : Ema(srcHTF, fast_length)
slow_ma = sma_source ? Sma(srcHTF, slow_length) : Ema(srcHTF, slow_length)

macd = fast_ma - slow_ma
signal = sma_signal ? Sma(macd, signal_length) : Ema(macd, signal_length)
hist = macd - signal

//plot(hist, title="Histogram", style=plot.style_columns, color=(hist>=0 ? (hist[1] < hist ? col_grow_above : col_fall_above) : (hist[1] < hist ? col_grow_below : col_fall_below) ), transp=0 )
plot(macd, title="MACD", color=col_macd, transp=0)
plot(signal, title="Signal", color=col_signal, transp=0)

/// MFI

MFIsource = hlc3
sourceHTF = security(syminfo.tickerid, res, MFIsource[barstate.isrealtime ? 1 : 0])
length = input(15, minval=1)
lower = input(12, minval=0, maxval=50)
upper = input(80, minval=50, maxval=100)

// DrawMFI_f=input(true, title="Draw MFI?", type=bool)
HighlightBreaches=input(true, title="Highlight Oversold/Overbought?")

volumeHTF = security(syminfo.tickerid, res, volume[barstate.isrealtime ? 1 : 0])

// MFI
upper_s = sum(volumeHTF * (change(sourceHTF) <= 0 ? 0 : sourceHTF), length)
lower_s = sum(volumeHTF * (change(sourceHTF) >= 0 ? 0 : sourceHTF), length)
mf = rsi(upper_s, lower_s)
mfp = plot(mf, color=color.new(color.gray,0), linewidth=1)
top = hline(upper, color=color.new(color.gray, 100), linewidth=1, editable=false)
bottom = hline(lower, color=color.new(color.gray,100), linewidth=1, editable=false)
hline(0, color=color.new(color.black,100), editable=false)
hline(100, color=color.new(color.black,100), editable=false)

// Breaches
b_color = (mf > upper) ? color.new(color.red,70) : (mf < lower) ? color.new(color.green,60) : na
bgcolor(HighlightBreaches ? b_color : na)

fill(top, bottom, color=color.gray, transp=75)

// TAKE PROFIT AND STOP LOSS
long_tp1_inp = input(1, title='Long Take Profit 1 %', step=0.1)/100
long_tp1_qty = input(20, title="Long Take Profit 1 Qty", step=1)

long_trailing = input(1.3, title='Trailing Stop Long', step=0.1) / 100

long_take_level_1 = strategy.position_avg_price * (1 + long_tp1_inp)

// Stop Loss
multiplier = input(2, "SL Mutiplier", minval=1, step=0.1)
ATR_period=input(40,"ATR period", minval=1, step=1)

// Strategy
entry_long=(crossover(macd,signal) or (crossover(mf,lower) and leadLine2 < leadLine1)) and rsi < belowRSIFilter and close > aboveTrendFilter
entry_price_long=valuewhen(entry_long,close,0)
//SL_floating_long = entry_price_long -( (entry_price_long)*multiplier/100)//*Atr(ATR_period,res)
//SL_floating_long = entry_price_long - multiplier*Atr(ATR_period,res)
SL_floating_long = entry_price_long - multiplier*Atr(ATR_period,res)
exit_long= close < SL_floating_long

///// BACKTEST PERIOD ///////
testStartYear = input(2018, "Backtest Start Year")
testStartMonth = input(1, "Backtest Start Month")
testStartDay = input(1, "Backtest Start Day")
testPeriodStart = timestamp(testStartYear, testStartMonth, testStartDay, 0, 0)

testStopYear = input(9999, "Backtest Stop Year")
testStopMonth = input(12, "Backtest Stop Month")
testStopDay = input(31, "Backtest Stop Day")
testPeriodStop = timestamp(testStopYear, testStopMonth, testStopDay, 0, 0)

testPeriod() =>
    time >= testPeriodStart and time <= testPeriodStop ? true : false

if testPeriod()
    if UT
        strategy.entry("long", strategy.long, when=entry_long == true, comment=openlongcomment)
    strategy.exit("TP1","long", qty_percent=long_tp1_qty, limit=long_take_level_1)
    strategy.exit("Trail stop","long",  comment=closelongcomment,  trail_points=entry_price_long * long_trailing / syminfo.mintick, trail_offset=entry_price_long * long_trailing / syminfo.mintick)
    strategy.close("long", exit_long == true,  comment=closelongcomment )