Estratégia de compra e venda de engolfo de alta
Visão geral
A estratégia de compra e venda de Bullish Engulfing é uma estratégia de negociação quantitativa baseada no K-line. A estratégia capta oportunidades de reversão do preço das ações para obter lucro, identificando o K-line do Bullish Engulfing.
As principais vantagens desta estratégia são:
- Identificar oportunidades de reversão de preços com alta probabilidade com base em teoria de análise técnica consolidada
- Sinais de negociação simples e intuitivos
- Riscos controlados
Princípio da estratégia
A estratégia baseia-se no padrão Bullish Engulfing para determinar a inversão de preços.
Quando as ações estão em uma tendência de queda, se um menor K-line de uma entidade surgir, uma entidade de uma K-line seguinte engolfará completamente a entidade de uma K-line anterior, e o preço de encerramento será maior que o preço máximo da K-line anterior, formando o Engulfamento de Sol de Bullish Engulfing, indicando que o preço está prestes a produzir uma reversão e o preço das ações subirá.
A estratégia abre mais posições ao identificar o Bullish Engulfing e define um Stop Loss Exit, com um objetivo de ganho de 1%, um stop loss de 1% e um lock-in de lucro.
Análise de vantagens estratégicas
A estratégia tem as seguintes vantagens:
- Baseado em teoria de análise técnica, Bullish Engulfing Sun Swallows são sinais de reversão de preços de alta probabilidade, que podem efetivamente capturar oportunidades de reversão de preços.
- Os sinais de negociação são simples, intuitivos, fáceis de entender e adequados para transações quantitativas.
- A adoção de variedades de alta liquidez, como os futuros de índices de ações, pode permitir a entrada e saída de alta eficiência.
- A configuração do Stop Stop Loss Exit permite um bom controle da taxa de ganho/perda de uma única transação, garantindo resultados lucrativos e evitando grandes perdas.
- Os parâmetros da estratégia podem ser ajustados de forma flexível para adaptar-se a diferentes variedades e condições de mercado.
Análise de risco estratégico
A estratégia também apresenta alguns riscos:
- De acordo com a teoria da análise técnica, existe um certo risco de sinais errados.
- Mudanças nas condições do mercado podem fazer com que os parâmetros falhem e precisem ser ajustados.
- Se a paragem for muito pequena, a perda pode ser pequena, e se for muito grande, a perda pode ser grande.
Para combater esses riscos, podemos tomar as seguintes medidas:
- Parâmetros de otimização para verificar a eficácia em diferentes mercados.
- Aumentar a amplitude de stop loss para garantir que o stop loss individual seja controlado dentro de uma faixa aceitável.
- Variedades de negociação com boa liquidez e volatilidade moderada, como índices ou futuros de índices de ações.
Direção de otimização da estratégia
A estratégia também pode ser melhorada em:
- Combinação de filtros de indicadores de tendência, como a inclusão de um julgamento de linha média, para evitar negociação de contrapartida.
- Aumentar a margem de queda e ampliar a margem de lucro.
- Otimização de mecanismos de stop loss, por exemplo, aumentando o stop loss gradualmente com a movimentação dos preços, reduzindo a probabilidade de stop loss.
- Utiliza-se uma combinação de outras formas de linhas K semelhantes às linhas Bullish Engulfing para formar uma combinação de transações.
Resumir
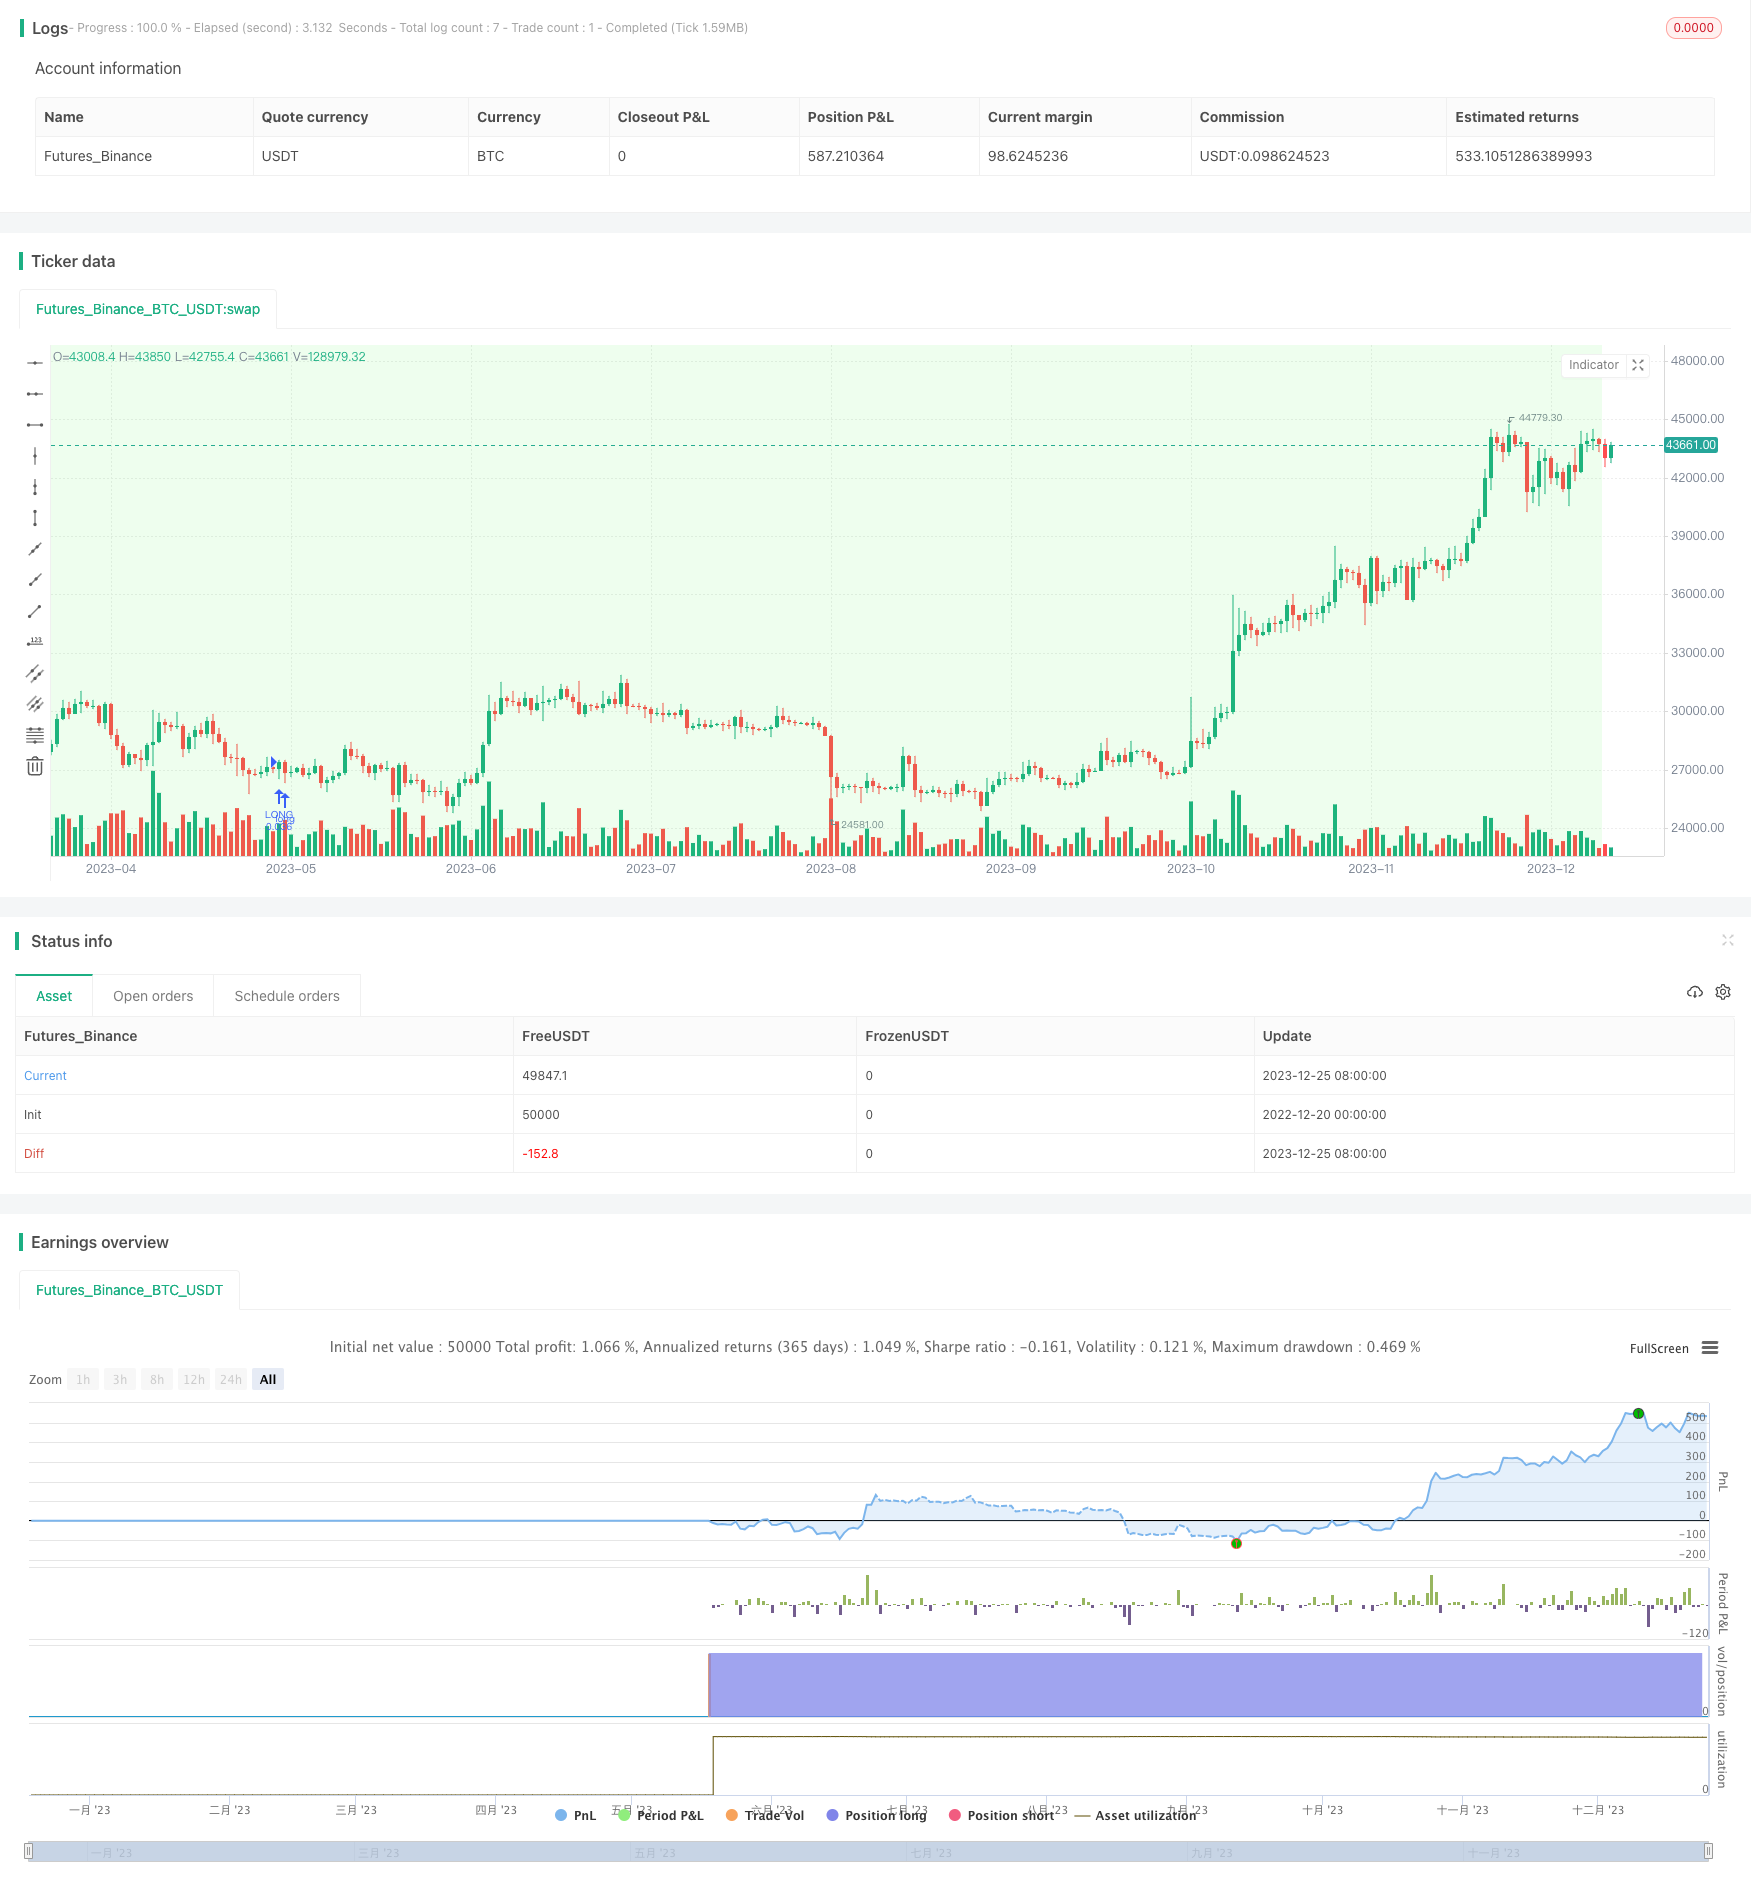
A estratégia de compra e venda de Bullish Engulfing é uma estratégia de negociação quantitativa baseada em análise técnica, com vantagens como sinais de negociação concisos, claros e fáceis de implementar. Com a otimização de parâmetros e medidas de controle de risco, é recomendável obter lucros estáveis.
/*backtest
start: 2022-12-20 00:00:00
end: 2023-12-26 00:00:00
period: 1d
basePeriod: 1h
exchanges: [{"eid":"Futures_Binance","currency":"BTC_USDT"}]
*/

// This source code is subject to the terms of the Mozilla Public License 2.0 at https://mozilla.org/MPL/2.0/
// © thequantscience

// ██████╗ ██╗   ██╗██╗     ██╗     ██╗███████╗██╗  ██╗    ███████╗███╗   ██╗ ██████╗ ██╗   ██╗██╗     ███████╗██╗███╗   ██╗ ██████╗
// ██╔══██╗██║   ██║██║     ██║     ██║██╔════╝██║  ██║    ██╔════╝████╗  ██║██╔════╝ ██║   ██║██║     ██╔════╝██║████╗  ██║██╔════╝
// ██████╔╝██║   ██║██║     ██║     ██║███████╗███████║    █████╗  ██╔██╗ ██║██║  ███╗██║   ██║██║     █████╗  ██║██╔██╗ ██║██║  ███╗
// ██╔══██╗██║   ██║██║     ██║     ██║╚════██║██╔══██║    ██╔══╝  ██║╚██╗██║██║   ██║██║   ██║██║     ██╔══╝  ██║██║╚██╗██║██║   ██║
// ██████╔╝╚██████╔╝███████╗███████╗██║███████║██║  ██║    ███████╗██║ ╚████║╚██████╔╝╚██████╔╝███████╗██║     ██║██║ ╚████║╚██████╔╝
// ╚═════╝  ╚═════╝ ╚══════╝╚══════╝╚═╝╚══════╝╚═╝  ╚═╝    ╚══════╝╚═╝  ╚═══╝ ╚═════╝  ╚═════╝ ╚══════╝╚═╝     ╚═╝╚═╝  ╚═══╝ ╚═════╝

//@version=5
strategy(
     "Buy&Sell Bullish Engulfing - The Quant Science",
     overlay = true,
     default_qty_type = strategy.percent_of_equity,
     default_qty_value = 100,
     pyramiding = 1,
     currency = currency.EUR,
     initial_capital = 10000,
     commission_type = strategy.commission.percent,
     commission_value = 0.07,
     process_orders_on_close = true,
     close_entries_rule = "ANY"
     )

startDate  = input.int(title="D: ", defval=1,    minval=1,    maxval=31,   inline = 'Start', group = "START DATE BACKTESTING", tooltip = "D is Day, M is Month, Y is Year.")
startMonth = input.int(title="M: ", defval=1,    minval=1,    maxval=12,   inline = 'Start', group = "START DATE BACKTESTING", tooltip = "D is Day, M is Month, Y is Year.")
startYear  = input.int(title="Y: ", defval=2022, minval=1800, maxval=2100, inline = 'Start', group = "START DATE BACKTESTING", tooltip = "D is Day, M is Month, Y is Year.")

endDate    = input.int(title="D: ", defval=31,   minval=1,    maxval=31,   inline = 'End',   group = "END DATE BACKTESTING", tooltip = "D is Day, M is Month, Y is Year.")
endMonth   = input.int(title="M: ", defval=12,   minval=1,    maxval=12,   inline = 'End',   group = "END DATE BACKTESTING", tooltip = "D is Day, M is Month, Y is Year.")
endYear    = input.int(title="Y: ", defval=2023, minval=1800, maxval=2100, inline = 'End',   group = "END DATE BACKTESTING", tooltip = "D is Day, M is Month, Y is Year.")

inDateRange = (time >= timestamp(syminfo.timezone, startYear, startMonth, startDate, 0, 0)) and (time < timestamp(syminfo.timezone, endYear, endMonth, endDate, 0, 0))

PROFIT   = input.float(defval = 1, minval = 0, title = "Target profit (%): ", step = 0.10, group = "TAKE PROFIT-STOP LOSS")
STOPLOSS = input.float(defval = 1, minval = 0, title = "Stop Loss (%): ",     step = 0.10, group = "TAKE PROFIT-STOP LOSS")

var float equity_trades = 0
strategy.initial_capital = 50000
equity_trades := strategy.initial_capital
var float equity   = 0
var float qty_order   = 0
t_ordersize = "Percentage size of each new order. With 'Reinvestment Profit' activate, the size will be calculate on the equity, with 'Reinvestment Profit' deactivate the size will be calculate on the initial capital."
orders_size = input.float(defval = 2, title = "Orders size (%): ", minval = 0.10, step = 0.10,  maxval = 100, group = "RISK MANAGEMENT", tooltip = t_ordersize)
qty_order := ((equity_trades * orders_size) / 100 ) / close

C_DownTrend = true
C_UpTrend   = true
var trendRule1 = "SMA50"
var trendRule2 = "SMA50, SMA200"
var trendRule = input.string(trendRule1, "Detect Trend Based On", options=[trendRule1, trendRule2, "No detection"], group = "BULLISH ENGULFING")

if trendRule == trendRule1
	priceAvg = ta.sma(close, 50)
	C_DownTrend := close < priceAvg
	C_UpTrend := close > priceAvg

if trendRule == trendRule2
	sma200 = ta.sma(close, 200)
	sma50  = ta.sma(close, 50)
	C_DownTrend := close < sma50 and sma50 < sma200
	C_UpTrend := close > sma50 and sma50 > sma200
C_Len = 14
C_ShadowPercent = 5.0
C_ShadowEqualsPercent = 100.0
C_DojiBodyPercent = 5.0
C_Factor = 2.0

C_BodyHi = math.max(close, open)
C_BodyLo = math.min(close, open)
C_Body = C_BodyHi - C_BodyLo
C_BodyAvg = ta.ema(C_Body, C_Len)
C_SmallBody = C_Body < C_BodyAvg
C_LongBody = C_Body > C_BodyAvg
C_UpShadow = high - C_BodyHi
C_DnShadow = C_BodyLo - low
C_HasUpShadow = C_UpShadow > C_ShadowPercent / 100 * C_Body
C_HasDnShadow = C_DnShadow > C_ShadowPercent / 100 * C_Body
C_WhiteBody = open < close
C_BlackBody = open > close
C_Range = high-low
C_IsInsideBar = C_BodyHi[1] > C_BodyHi and C_BodyLo[1] < C_BodyLo
C_BodyMiddle = C_Body / 2 + C_BodyLo
C_ShadowEquals = C_UpShadow == C_DnShadow or (math.abs(C_UpShadow - C_DnShadow) / C_DnShadow * 100) < C_ShadowEqualsPercent and (math.abs(C_DnShadow - C_UpShadow) / C_UpShadow * 100) < C_ShadowEqualsPercent
C_IsDojiBody = C_Range > 0 and C_Body <= C_Range * C_DojiBodyPercent / 100
C_Doji = C_IsDojiBody and C_ShadowEquals

patternLabelPosLow  = low  - (ta.atr(30) * 0.6)
patternLabelPosHigh = high + (ta.atr(30) * 0.6)

label_color_bullish = input.color(color.rgb(43, 255, 0), title = "Label Color Bullish", group = "BULLISH ENGULFING")
C_EngulfingBullishNumberOfCandles = 2
C_EngulfingBullish = C_DownTrend and C_WhiteBody and C_LongBody and C_BlackBody[1] and C_SmallBody[1] and close >= open[1] and open <= close[1] and ( close > open[1] or open < close[1] )
if C_EngulfingBullish
    var ttBullishEngulfing = "Engulfing\nAt the end of a given downward trend, there will most likely be a reversal pattern. To distinguish the first day, this candlestick pattern uses a small body, followed by a day where the candle body fully overtakes the body from the day before, and closes in the trend’s opposite direction. Although similar to the outside reversal chart pattern, it is not essential for this pattern to completely overtake the range (high to low), rather only the open and the close."
    label.new(bar_index, patternLabelPosLow, text="BE", style=label.style_label_up, color = label_color_bullish, textcolor=color.white, tooltip = ttBullishEngulfing)
bgcolor(ta.highest(C_EngulfingBullish?1:0, C_EngulfingBullishNumberOfCandles)!=0 ? color.new(#21f321, 90) : na, offset=-(C_EngulfingBullishNumberOfCandles-1))

var float c       = 0
var float o       = 0
var float c_exit  = 0
var float c_stopl = 0

if C_EngulfingBullish and strategy.opentrades==0 and inDateRange
    c := strategy.equity
    o := close
    c_exit  := c + (c * PROFIT / 100)
    c_stopl := c - (c * STOPLOSS / 100)
    strategy.entry(id = "LONG", direction = strategy.long, qty = qty_order, limit = o)

if ta.crossover(strategy.equity, c_exit)
    strategy.exit(id = "CLOSE-LONG", from_entry = "LONG", limit = close)
if ta.crossunder(strategy.equity, c_stopl)
    strategy.exit(id = "CLOSE-LONG", from_entry = "LONG", limit = close)