Estratégia de sobrecompra e sobrevenda do RSI lento
Visão geral
A estratégia de supercompra e supervenda do RSI lento abre novas oportunidades de negociação ao prolongar o período de retorno do RSI e reduzir a volatilidade da curva RSI. A estratégia também se aplica a outros indicadores técnicos, como o MACD.
Princípio da estratégia
A ideia central da estratégia é prolongar o período de retrospectiva do RSI, assumindo 500 ciclos por defeito, e depois suavizar a curva do RSI através do SMA, com um período por defeito de 250. Isso pode reduzir drasticamente a volatilidade da curva do RSI, diminuindo a velocidade de resposta do RSI, gerando novas oportunidades de negociação.
O longo período de retracção enfraquece a volatilidade da curva RSI, portanto, os critérios para determinar a sobrecompra e a sobrevenda também precisam ser ajustados. A estratégia configura uma linha de sobrecompra 52 e uma linha de sobrevenda 48 personalizadas.
Vantagens estratégicas
- Inovadores, criando novas ideias de negócios com ciclos mais longos
- A redução de sinais falsos e a melhoria da estabilidade
- O valor do limite de venda e venda pode ser personalizado para diferentes mercados
- Pode ser plantado para aumentar a taxa de retorno
Risco estratégico
- Perder uma oportunidade de curta duração
- A paciência é necessária para esperar a oportunidade de entrar.
- O excesso de compra e venda pode aumentar os prejuízos.
- Risco de arbitragem
Solução:
- Reduzir adequadamente os ciclos e aumentar a frequência das transações
- A construção de armazéns por lotes, para dispersão de riscos
- Optimizar os parâmetros de depreciação para adaptar-se a diferentes cenários de mercado
- Estabeleça um ponto de parada para evitar grandes perdas
Direção de otimização da estratégia
- Optimizar os parâmetros do RSI para encontrar a melhor combinação de períodos
- Testar diferentes parâmetros de ciclo de suavização SMA
- Optimizar os parâmetros de sobrecompra e sobrevenda para diferentes mercados
- Adição de estratégias de stop loss para controlar perdas individuais
Resumir
A estratégia de supercompra e supervenda de RSI lenta abriu com sucesso novas ideias de negociação por meio do prolongamento do ciclo e da supressão da flutuação da linha média. A estratégia promete obter lucros extras estáveis e eficientes, com otimizamento dos parâmetros e o controle do risco.
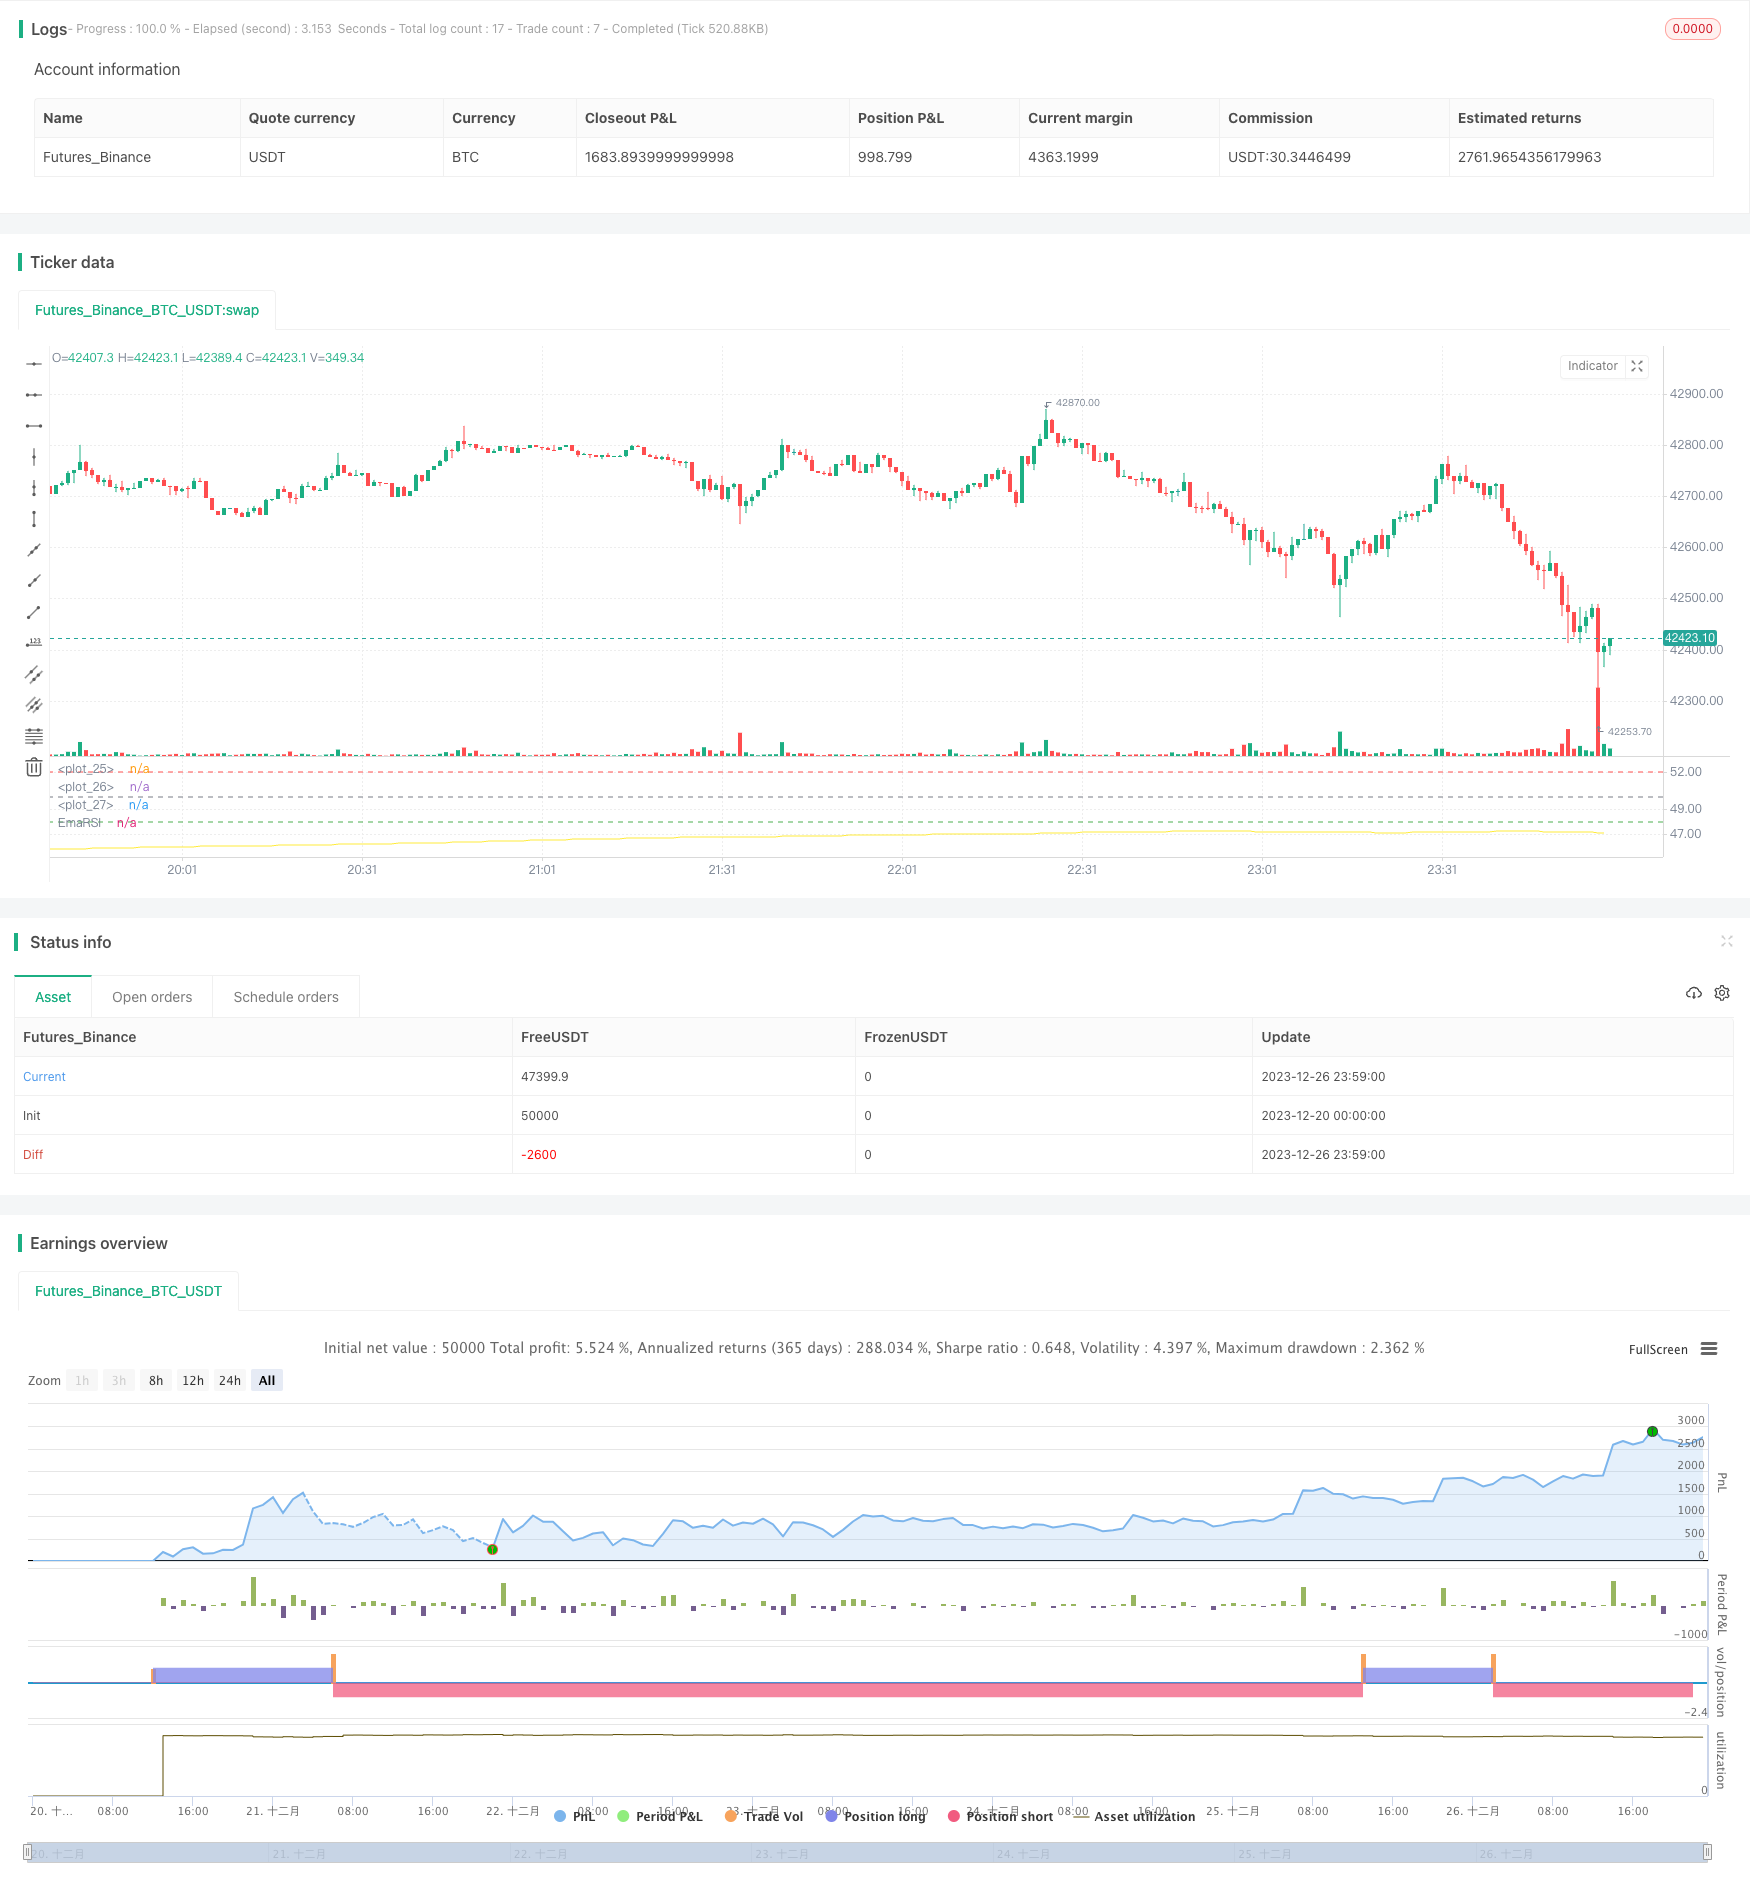
/*backtest
start: 2023-12-20 00:00:00
end: 2023-12-27 00:00:00
period: 1m
basePeriod: 1m
exchanges: [{"eid":"Futures_Binance","currency":"BTC_USDT"}]
*/


// Wilder was a very influential man when it comes to TA. However, I'm one to always try to think outside the box.
// While Wilder recommended that the RSI be used only with a 14 bar lookback period, I on the other hand think there is a lot to learn from RSI if one simply slows down the lookback period
// Same applies for MACD.
// Every market has its dynmaics. So don't narrow your mind by thinking my source code input levels are the only levels that work.
// Since the long lookback period weakens the plot volatility, again, one must think outside the box when trying to guage overbought and oversold levels.

// Good luck and don't bash me if some off-the-wall FA spurned divergence causes you to lose money.
// And NO this doesn't repaint and I won't answer those who ask.
//@version=4

strategy("SLOW RSI OB/OS Strategy", overlay=false)
price = input(ohlc4, title="Price Source")
len = input(500, minval=1, step=5,  title="RSI Length")
smoother = input(250, minval=1, step=5, title="RSI SMA")
up = rma(max(change(price), 0), len)
down = rma(-min(change(price), 0), len)
rsi = down == 0 ? 100 : up == 0 ? 0 : 100 - (100 / (1 + up / down))
EmaRSI = ema(rsi,smoother)
plot(EmaRSI, title="EmaRSI", style=line, linewidth=1, color=yellow)


OB = input(52, step=0.1)
OS = input(48, step=0.1)
hline(OB, linewidth=1, color=red)
hline(OS,linewidth=1, color=green)
hline(50,linewidth=1, color=gray)


long = change(EmaRSI) > 0 and EmaRSI <= 50 and crossover(EmaRSI, OS)
short = change(EmaRSI) < 0 and EmaRSI >= 50 and crossunder(EmaRSI, OB)


strategy.entry("Long", strategy.long, when=long) //_signal or long) //or closeshort_signal)
strategy.entry("Short", strategy.short, when=short) //_signal or short) // or closelong_signal)

// If you want to try to play with exits you can activate these!

//closelong = crossunder(EmaRSI, 0) //or crossunder(EmaRSI, OS)
//closeshort = crossover(EmaRSI, 0) //or crossover(EmaRSI, OB)

//strategy.close("Long", when=closelong)
//strategy.close("Short", when=closeshort)