Estratégia de otimização de stop loss dinâmica com base na estratégia de rede de pesca
Visão geral
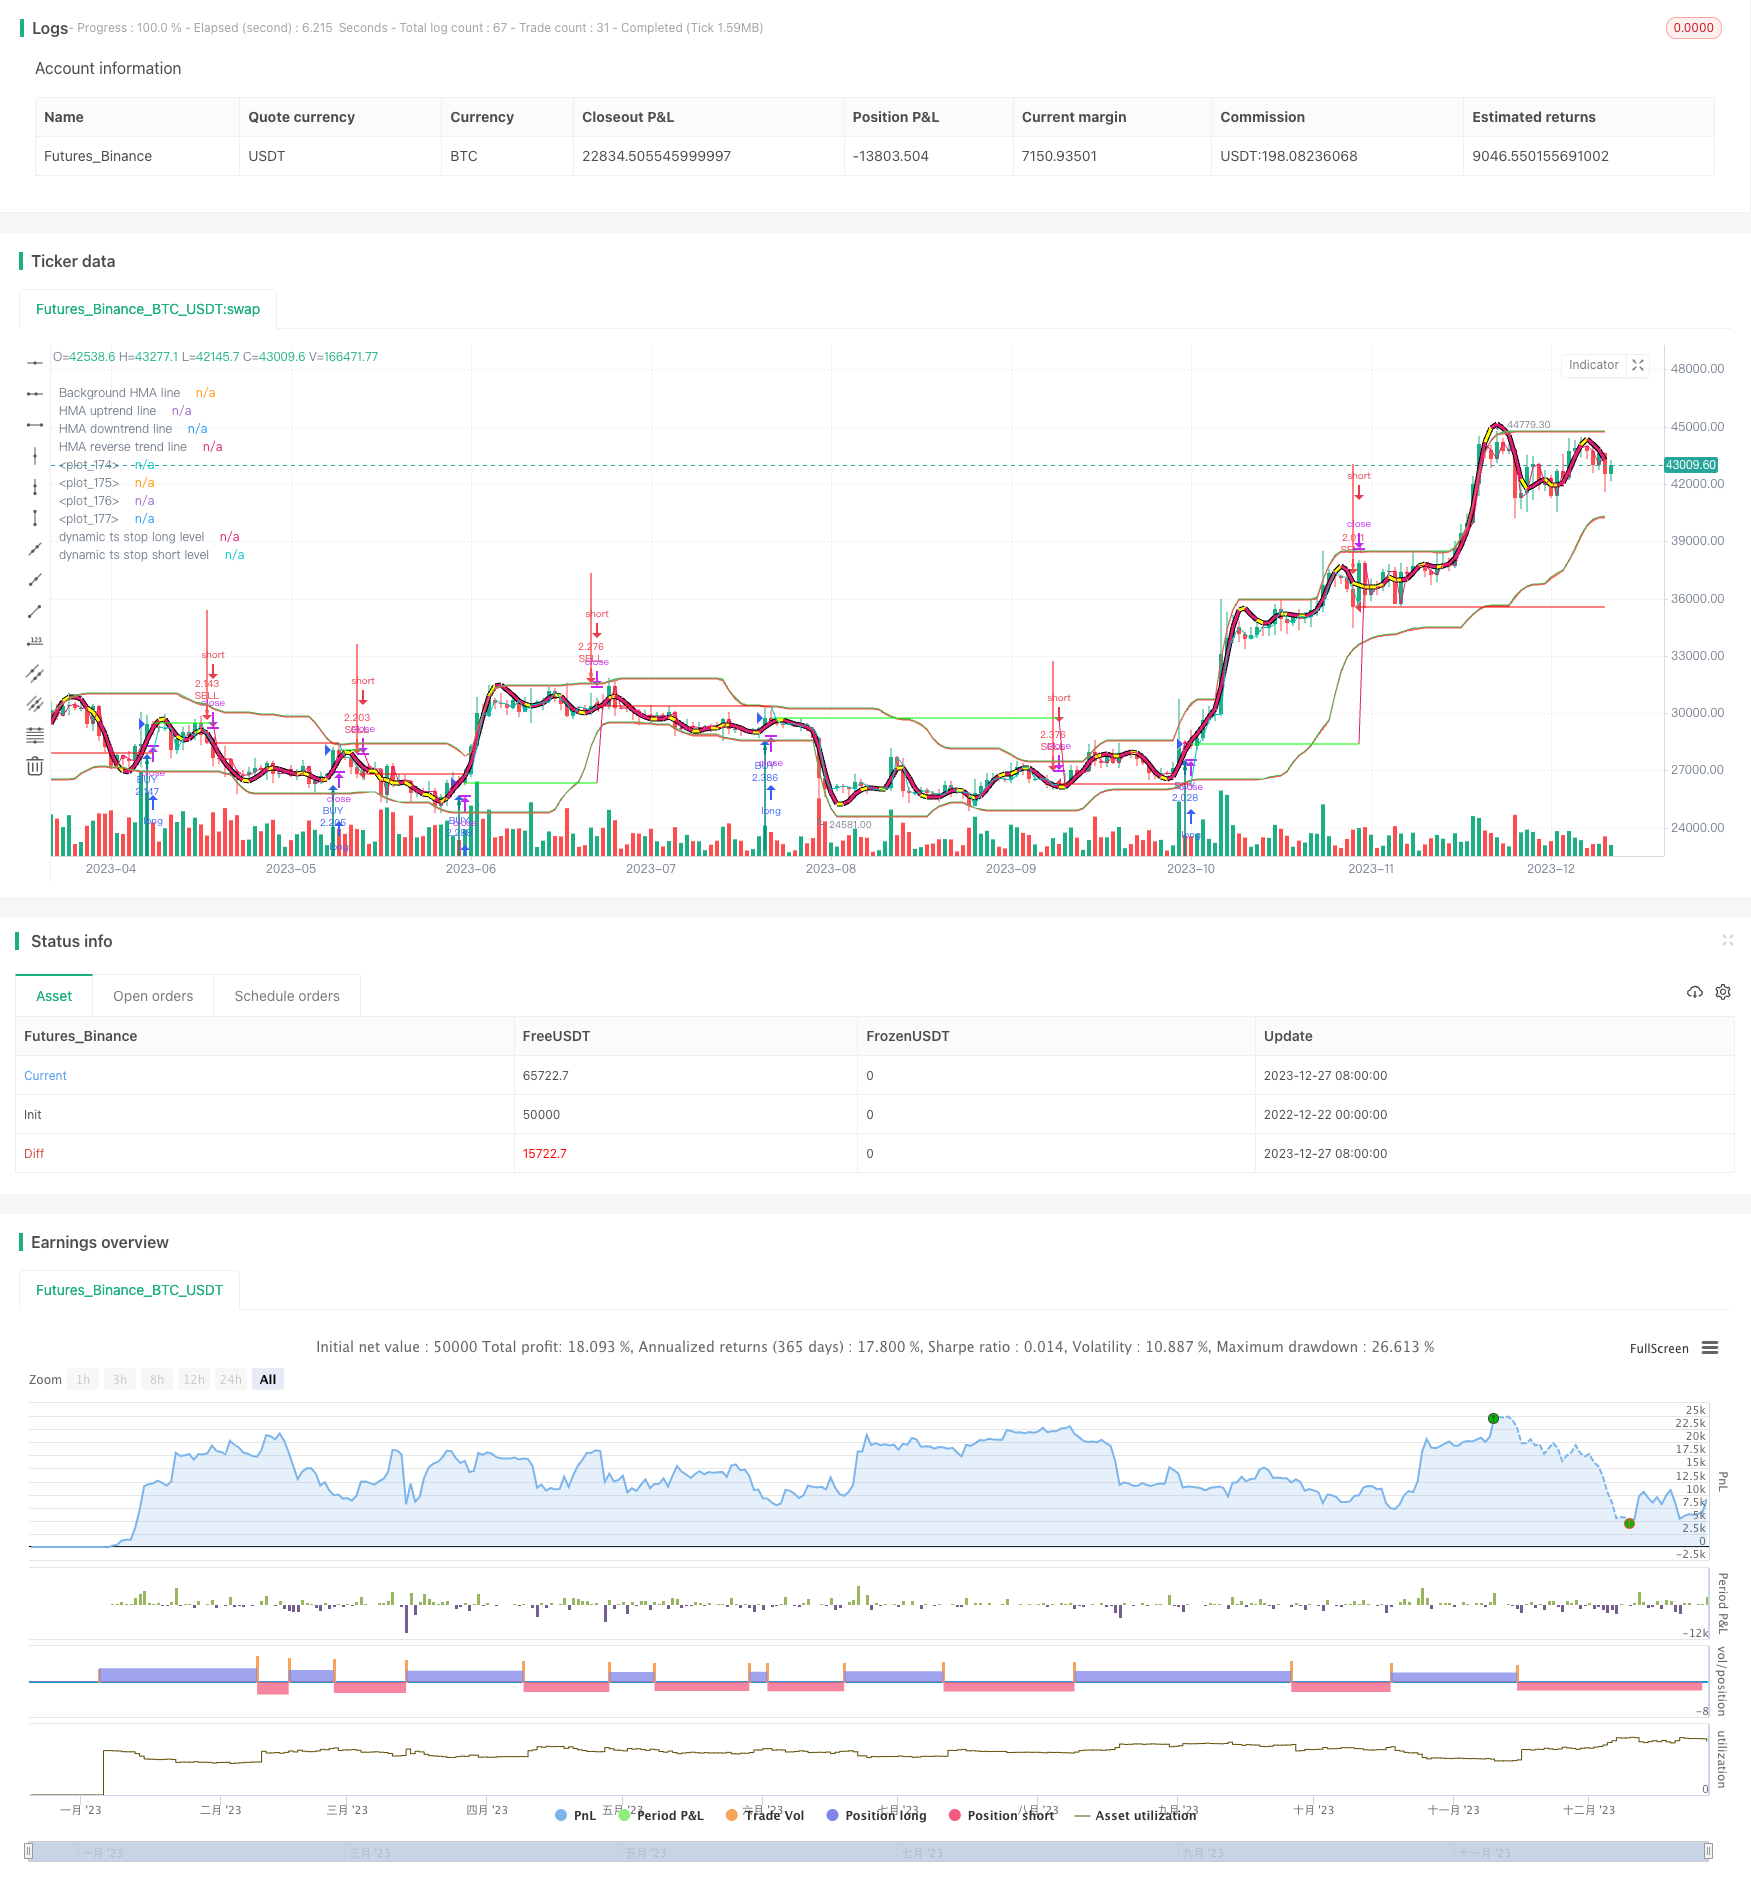
A ideia central desta estratégia é combinar a estratégia da rede de pesca e o mecanismo de parada móvel dinâmico para obter uma saída de parada mais eficiente. A estratégia da rede de pesca determina a tendência e a posição do mercado através do indicador de linha K, determinando dinamicamente o momento de compra e venda.
Princípios
A estratégia baseia-se nos seguintes módulos:
- Módulo de indicadores de redes de pesca
Computação de indicadores de redes de pesca através de estresse de Fisher e Stoch para determinar tendências de mercado e pontos de venda.
- Módulo de parada dinâmica
Calcule o ponto de parada de acordo com o ATR e RSI indicador dinâmico, para realizar o traçado de parada dinâmico.
- Módulo de rastreamento de perda móvel
Estabelecer um número fixo de pontos de deslocamento de stop loss e sair da posição quando o preço atingir o ponto de stop loss.
Análise de vantagens
A maior vantagem desta estratégia é a excelente capacidade de controle de risco. O mecanismo de stop loss dinâmico pode definir o tamanho de stop loss adequado de acordo com a volatilidade do mercado, evitando efetivamente os prejuízos causados por deslizamentos excessivos, e pode acompanhar a tendência melhor do que o stop loss fixo. Além disso, o indicador de rede de pesca determina com precisão e confiabilidade o momento de compra e venda e pode filtrar parte do ruído das negociações.
Análise de Riscos
O principal risco desta estratégia é que a configuração inadequada do ponto de parada pode levar a saídas excessivamente radicais. Além disso, a configuração de parâmetros excessivamente radicais também pode levar a negociações de whipsaw com muita frequência. Para reduzir esses riscos, os parâmetros devem ser selecionados de forma razoável, evitando a configuração de uma amplitude de movimento excessiva.
Direção de otimização
O espaço de otimização desta estratégia concentra-se nas seguintes áreas:
Otimizar os parâmetros dos indicadores das redes de pesca para encontrar melhores combinações de parâmetros para determinar as tendências;
Otimizar os parâmetros de stop loss dinâmicos para encontrar uma amplitude de stop loss mais equilibrada;
Adição de um módulo de gerenciamento de posições baseado na volatilidade, ajustando as posições de acordo com a volatilidade do mercado.
A busca de parâmetros e a otimização de regras permitem que a estratégia obtenha um maior Retorno Ajustado ao Risco.
Resumir
Esta estratégia combina a aplicação de indicadores de rede de pesca e a tecnologia de parada dinâmica para determinar com maior precisão a tendência do mercado, favorecendo a tomada de decisões no momento, além de ajustar dinamicamente a amplitude de parada e controlar eficazmente o risco. Através da expansão contínua do módulo e otimização de parâmetros, esta estratégia pode se tornar uma estrutura de estratégia eficaz que pode ser aplicada a longo prazo.
/*backtest
start: 2022-12-22 00:00:00
end: 2023-12-28 00:00:00
period: 1d
basePeriod: 1h
exchanges: [{"eid":"Futures_Binance","currency":"BTC_USDT"}]
*/

//@version=4
strategy("IFTS+TS Strategy Overlay ", overlay=true, pyramiding = 0, calc_on_order_fills = false, commission_type =  strategy.commission.percent, commission_value = 0.0454, default_qty_type = strategy.percent_of_equity, default_qty_value = 100)

//INPUTS
stochlength=input(19, "Stoch & ATR Length")
wmalength=input(4, title="Smooth")
ul = input(82.05,step=0.01, title="UP line")
dl = input(19,step=0.01, title="DOWN line")
uts = input(true, title="Use trailing stop")
rts = input(false, title="Re-enter after trailing stop")
tsi = input(title="trailing stop actiation pips",defval=245)
tso = input(title="trailing stop offset pips",defval=20)
udts = input(true, title="Use dynamic trailing stop start")
mpl2 = input(68.3,step=0.05, title="Multiplier for Dynamic TS start X*ATR")
udto = input(true, title="Use dynamic trailing stop offset")
mpl = input(1,step=0.01, title="Multiplier for Dynamic TS offset X*ATR")
occ = input(1, title="Occurancy for dynamic TS")
useCurrentRes = input(true, title="Use Current Chart Resolution?")
resCustom = input(title="Timeframe",defval="30")
hma = input(title="Plot Hull MA", defval=true)
pl = input(title="Plot all", defval=true)

//CALCULATIONS
v1=0.1*(stoch(close, high, low, stochlength)-50)
v2=wma(v1, wmalength)
k1=(exp(2*v2)-1)/(exp(2*v2)+1)*50+50
res = useCurrentRes ? timeframe.period : resCustom
k=security(syminfo.tickerid, res, k1, barmerge.lookahead_off)

//CALCULATIONS HULL MA
n=stochlength/2
n2ma=2*wma(close,round(n/2))
nma=wma(close,n)
diff=n2ma-nma
sqn=round(sqrt(n))
n2ma1=2*wma(close[1],round(n/2))
nma1=wma(close[1],n)
diff1=n2ma1-nma1
sqn1=round(sqrt(n))
n1=wma(diff,sqn)
n2=wma(diff1,sqn)
n3=n1-(n1*-1)
n4=n1+(n1)

//CALCULATIONS FOR BUY/SELL LEVELS
//stc=(stoch(close, high, low, stochlength))

//v3=0.1*(stoch(low, low, low, stochlength)-50)
//v4=wma(v3, wmalength)
//k3=(exp(2*v4)-1)/(exp(2*v4)+1)*50+50
//k2=security(syminfo.tickerid, res, k3, barmerge.lookahead_off)
//stl=(stoch(low, low, low, stochlength))

//v5=0.1*(stoch(high, high, high, stochlength)-50)
//v6=wma(v5, wmalength)
//k5=(exp(2*v6)-1)/(exp(2*v6)+1)*50+50
//k4=security(syminfo.tickerid, res, k5, barmerge.lookahead_off)
//sth=(stoch(high, high, high, stochlength))

//difc=k-stc
//difl=k2-stl+difc
//difh=k4-sth+difc

hg1=wma(highest(stochlength),wmalength)//-highest(stochlength)*(difh/10000)
hg=security(syminfo.tickerid, res, hg1, barmerge.lookahead_off)
hgob=hg-hg*((100-ul)/10000)
lw1=wma(lowest(stochlength),wmalength)//-lowest(stochlength)*(difl/10000)
lw=security(syminfo.tickerid, res, lw1, barmerge.lookahead_off)
lwos=lw+lw*(dl/10000)

////CONDITIONS CROSS
sell = crossunder(k,ul)? 1 : 0
buy = crossover(k,dl)? 1 : 0

////COUNT BARCOLORS
var countred = 0
if sell == 1
    countred := 1
if buy == 1
    countred := 0

var countgreen = 0
if buy == 1
    countgreen := 1
if sell == 1
    countgreen := 0

////CONDITIONS COUNT BARCOLORS
long=countgreen[1]==0 and countgreen==1 ? 1 : 0
short=countred[1]==0 and countred==1 ? 1 : 0

////COLORS
//STOCH
col = k>=k[1] ? color.aqua : color.red
col1 = countred[2]==1 ? na : #00FF00
col2 = countgreen[2]==1 ? na : #FF0000
col3 = countred[2]==1 ? na : color.yellow
col4 = countgreen[2]==1 ? na : color.yellow
//HMA
dif = n1[1]-n3
dif1 = dif>dif[1] and dif[1]>dif[2] ? na: #00FF00 //uptrend - green
dif3 = n4-n1[1]
dif2 = dif3>dif3[1] and dif3[1]>dif3[2] ? na: #FF0000  //downtrend - red
dif4 = (dif>dif[1] and dif[1]>dif[2]) == (dif3>dif3[1] and dif3[1]>dif3[2]) ? #FFFF00: na //trend change - yellow

////PLOTS CALCULATIONS DYNAMIC TS
dtso1 = sma(atr(stochlength),2)*100
dtso=security(syminfo.tickerid, "1", dtso1,barmerge.lookahead_on)*mpl
dtsi = rsi(atr(stochlength),stochlength)/mpl2*tsi
dtsiv = valuewhen(long or short, dtsi, occ)
dtsov = valuewhen(long or short, dtso, occ)
//DYNAMIC TS START
dtsil1 = countred[2]==1 and pl and uts and udts? open+(dtsiv/100) : na
dtsis1 = countgreen[2]==1 and pl and uts and udts? open-(dtsiv/100) : na
dtsil = countred[2]==1 and pl and uts and udts? open+(dtsiv/100) : fixnan(dtsil1[1])
dtsis = countgreen[2]==1 and pl and uts and udts? open-(dtsiv/100) : fixnan(dtsis1[1])
//DYNAMIC TS OFFSET+START
dtsol1 = countred[2]==1 and pl and uts and udto? dtsil-(dtsov/100) : na
dtsos1 = countgreen[2]==1 and pl and uts and udto? dtsis+(dtsov/100) : na
dtsol = countred[2]==1 and pl and uts and udto? dtsil-(dtsov/100) : fixnan(dtsol1[1])
dtsos = countgreen[2]==1 and pl and uts and udto? dtsis+(dtsov/100) : fixnan(dtsos1[1])
//CONST TS START
tsil1 = countred[2]==1 and pl and uts and not udts? open+(tsi/100) : na
tsis1 = countgreen[2]==1 and pl and uts and not udts? open-(tsi/100) : na
tsil = countred[2]==1 and pl and uts and not udts? open+(tsi/100) : fixnan(tsil1[1])
tsis = countgreen[2]==1 and pl and uts and not udts? open-(tsi/100) : fixnan(tsis1[1])
//CONST TS START + DYNAMIC TS OFFSET
tsol21 = countred[2]==1 and pl and uts and not udts and udto? open+(tsi/100)-(dtsov/100) : na
tsos21 = countgreen[2]==1 and pl and uts and not udts and udto? open-(tsi/100)+(dtsov/100) : na
tsol2 = countred[2]==1 and pl and uts and not udts and udto? open+(tsi/100)-(dtsov/100) : fixnan(tsol21[1])
tsos2 = countgreen[2]==1 and pl and uts and not udts and udto? open-(tsi/100)+(dtsov/100) : fixnan(tsos21[1])
//CONST TS OFFSET
tsol1 = countred[2]==1 and pl and uts and not udto? tsil-(tso/100) : na
tsos1 = countgreen[2]==1 and pl and uts and not udto? tsis+(tso/100) : na
tsol = countred[2]==1 and pl and uts and not udto? tsil-(tso/100) : fixnan(tsol1[1])
tsos = countgreen[2]==1 and pl and uts and not udto? tsis+(tso/100) : fixnan(tsos1[1])

//////PLOTS
////LABELS
//TS LABELS
// ltsos = (short==1) and udto and pl? label.new(bar_index, high[1]+close*0.006,  text="os "+tostring(round(dtsov)), color=color.white, size=size.small) : na
// ltsol = (long==1) and udto and pl? label.new(bar_index, low[1]-close*0.006,  text="os "+tostring(round(dtsov)), color=color.white, size=size.small, style=label.style_labelup) : na
// ltsis = (short==1) and udts and pl? label.new(bar_index, high[1]+close*0.008, text="st "+tostring(round(dtsiv)), color=color.white, size=size.small) : na
// ltsil = (long==1) and udts and pl? label.new(bar_index, low[1]-close*0.008,  text="st "+tostring(round(dtsiv)), color=color.white, size=size.small, style=label.style_labelup) : na
//STOCH LABEL
//lk = k>ul and pl? label.new(bar_index, high, text=tostring(round(k)), color=col, size=size.small) :na
//lk2 = k<dl and pl? label.new(bar_index, high, text=tostring(round(k)), color=col, size=size.small) :na
//lk3 = k>dl and k<ul and pl? label.new(bar_index, high, text=tostring(round(k)), color=color.white, size=size.small) :na
//label.delete(lk[1])
//label.delete(lk2[1])
//label.delete(lk3[1])

//ltson = udto==true and pl? label.new(bar_index, 75, text="os "+tostring(round(dtso)), color=color.yellow, size=size.small) :na
//label.delete(ltson[1])
//ltsin = udts==true and pl? label.new(bar_index, 0, text="st "+tostring(round(dtsi)), color=color.yellow, size=size.small) :na
//label.delete(ltsin[1])

//DYNAMIC TS LINES
plot(dtsil, color=col1, transp = 0, title = "dynamic ts stop long level")
plot(dtsis, color=col2, transp = 0, title = "dynamic ts stop short level")
plot(dtsol, color=col3, transp = 30, title = "dynamic ts offset long level")
plot(dtsos, color=col4, transp = 30, title = "dynamic ts offset short level")
plot(tsol2, color=col3, transp = 30, title = "const start + dynamic ts offset long level")
plot(tsos2, color=col4, transp = 30, title = "const start + dynamic ts offset short level")
//TS LINES
plot(tsil, color=col1, transp = 0, title = "const ts stop long level")
plot(tsis, color=col2, transp = 0, title = "const ts stop short level")
plot(tsol, color=col3, transp = 30, title = "const ts stop offset long level")
plot(tsos, color=col4, transp = 30, title = "const ts stop offset short level")
//ARROWS
plotarrow(pl==true? long : na, colorup = color.teal, transp=0, title = "buy arrow")
plotarrow(pl==true? -short : na, colordown = color.red, transp=0, title = "sell arrow")
//HIGH/LOW
p1 = plot(pl==true?hg : na, color=color.green, transp=100, editable=false)
p2 = plot(pl==true?lw : na, color=color.red, transp=100, editable=false)
p3 = plot(pl==true?lwos : na, color=color.green, linewidth=1, transp=100, editable=false)
p4 = plot(pl==true?hgob : na, color=color.red, linewidth=1, transp=100, editable=false)
fill(p1,p4, color=color.green, transp=75, title = "highest price levels")
fill(p2,p3, color=color.red, transp=75, title = "lowest price levels")
//HMA
mab=plot(hma and pl ? n1 : na,color=#000000, linewidth=5, transp=0, title = "Background HMA line") //black
ma=plot(hma and pl ? n1 : na,color=dif1, linewidth=3, transp=10, title = "HMA uptrend line") //green
ma2=plot(hma and pl ? n1 : na,color=dif2, linewidth=3, transp=20, title = "HMA downtrend line")//red
ma3=plot(hma and pl ? n1 : na,color=dif4, linewidth=3, transp=10, title = "HMA reverse trend line") //yellow
//LINES
// ldl = long[1]==1 and uts and udts? line.new(bar_index, high, bar_index, dtsil, color=#00FF00, width = 1) : na
// lds = short[1]==1 and uts and udts? line.new(bar_index, high, bar_index, dtsis, color=#FF0000, width = 1) : na
// ll = long[1]==1 and uts and not udts? line.new(bar_index, high, bar_index, tsil, color=#00FF00, width = 1) : na
// ls = short[1]==1 and uts and not udts? line.new(bar_index, high, bar_index, tsis, color=#FF0000, width = 1) : na

////STRATEGY
strategy.entry("BUY", strategy.long, when = buy)
strategy.entry("SELL", strategy.short, when = sell)

if (rts)
    strategy.entry("BUY", strategy.long, when = countgreen==1 and dif1==#00FF00)
    strategy.entry("SELL", strategy.short, when = countred==1 and dif2==#FF0000)

if  (uts)
    strategy.exit("Close BUY with TS","BUY", trail_points = tsi, trail_offset = tso)
    strategy.exit("Close SELL with TS","SELL", trail_points = tsi, trail_offset = tso)

    if  (udto)
        strategy.exit("Close BUY with TS","BUY", trail_points = tsi, trail_offset = dtsov)
        strategy.exit("Close SELL with TS","SELL", trail_points = tsi, trail_offset = dtsov)

    if  (udts)
        strategy.exit("Close BUY with TS","BUY", trail_points = dtsiv, trail_offset = tso)
        strategy.exit("Close SELL with TS","SELL", trail_points = dtsiv, trail_offset = tso)

    if  (udto and udts)
        strategy.exit("Close BUY with TS","BUY", trail_points = dtsiv, trail_offset = dtsov)
        strategy.exit("Close SELL with TS","SELL", trail_points = dtsiv, trail_offset = dtsov)