Estratégia de rompimento de momentum em vários períodos
Visão geral
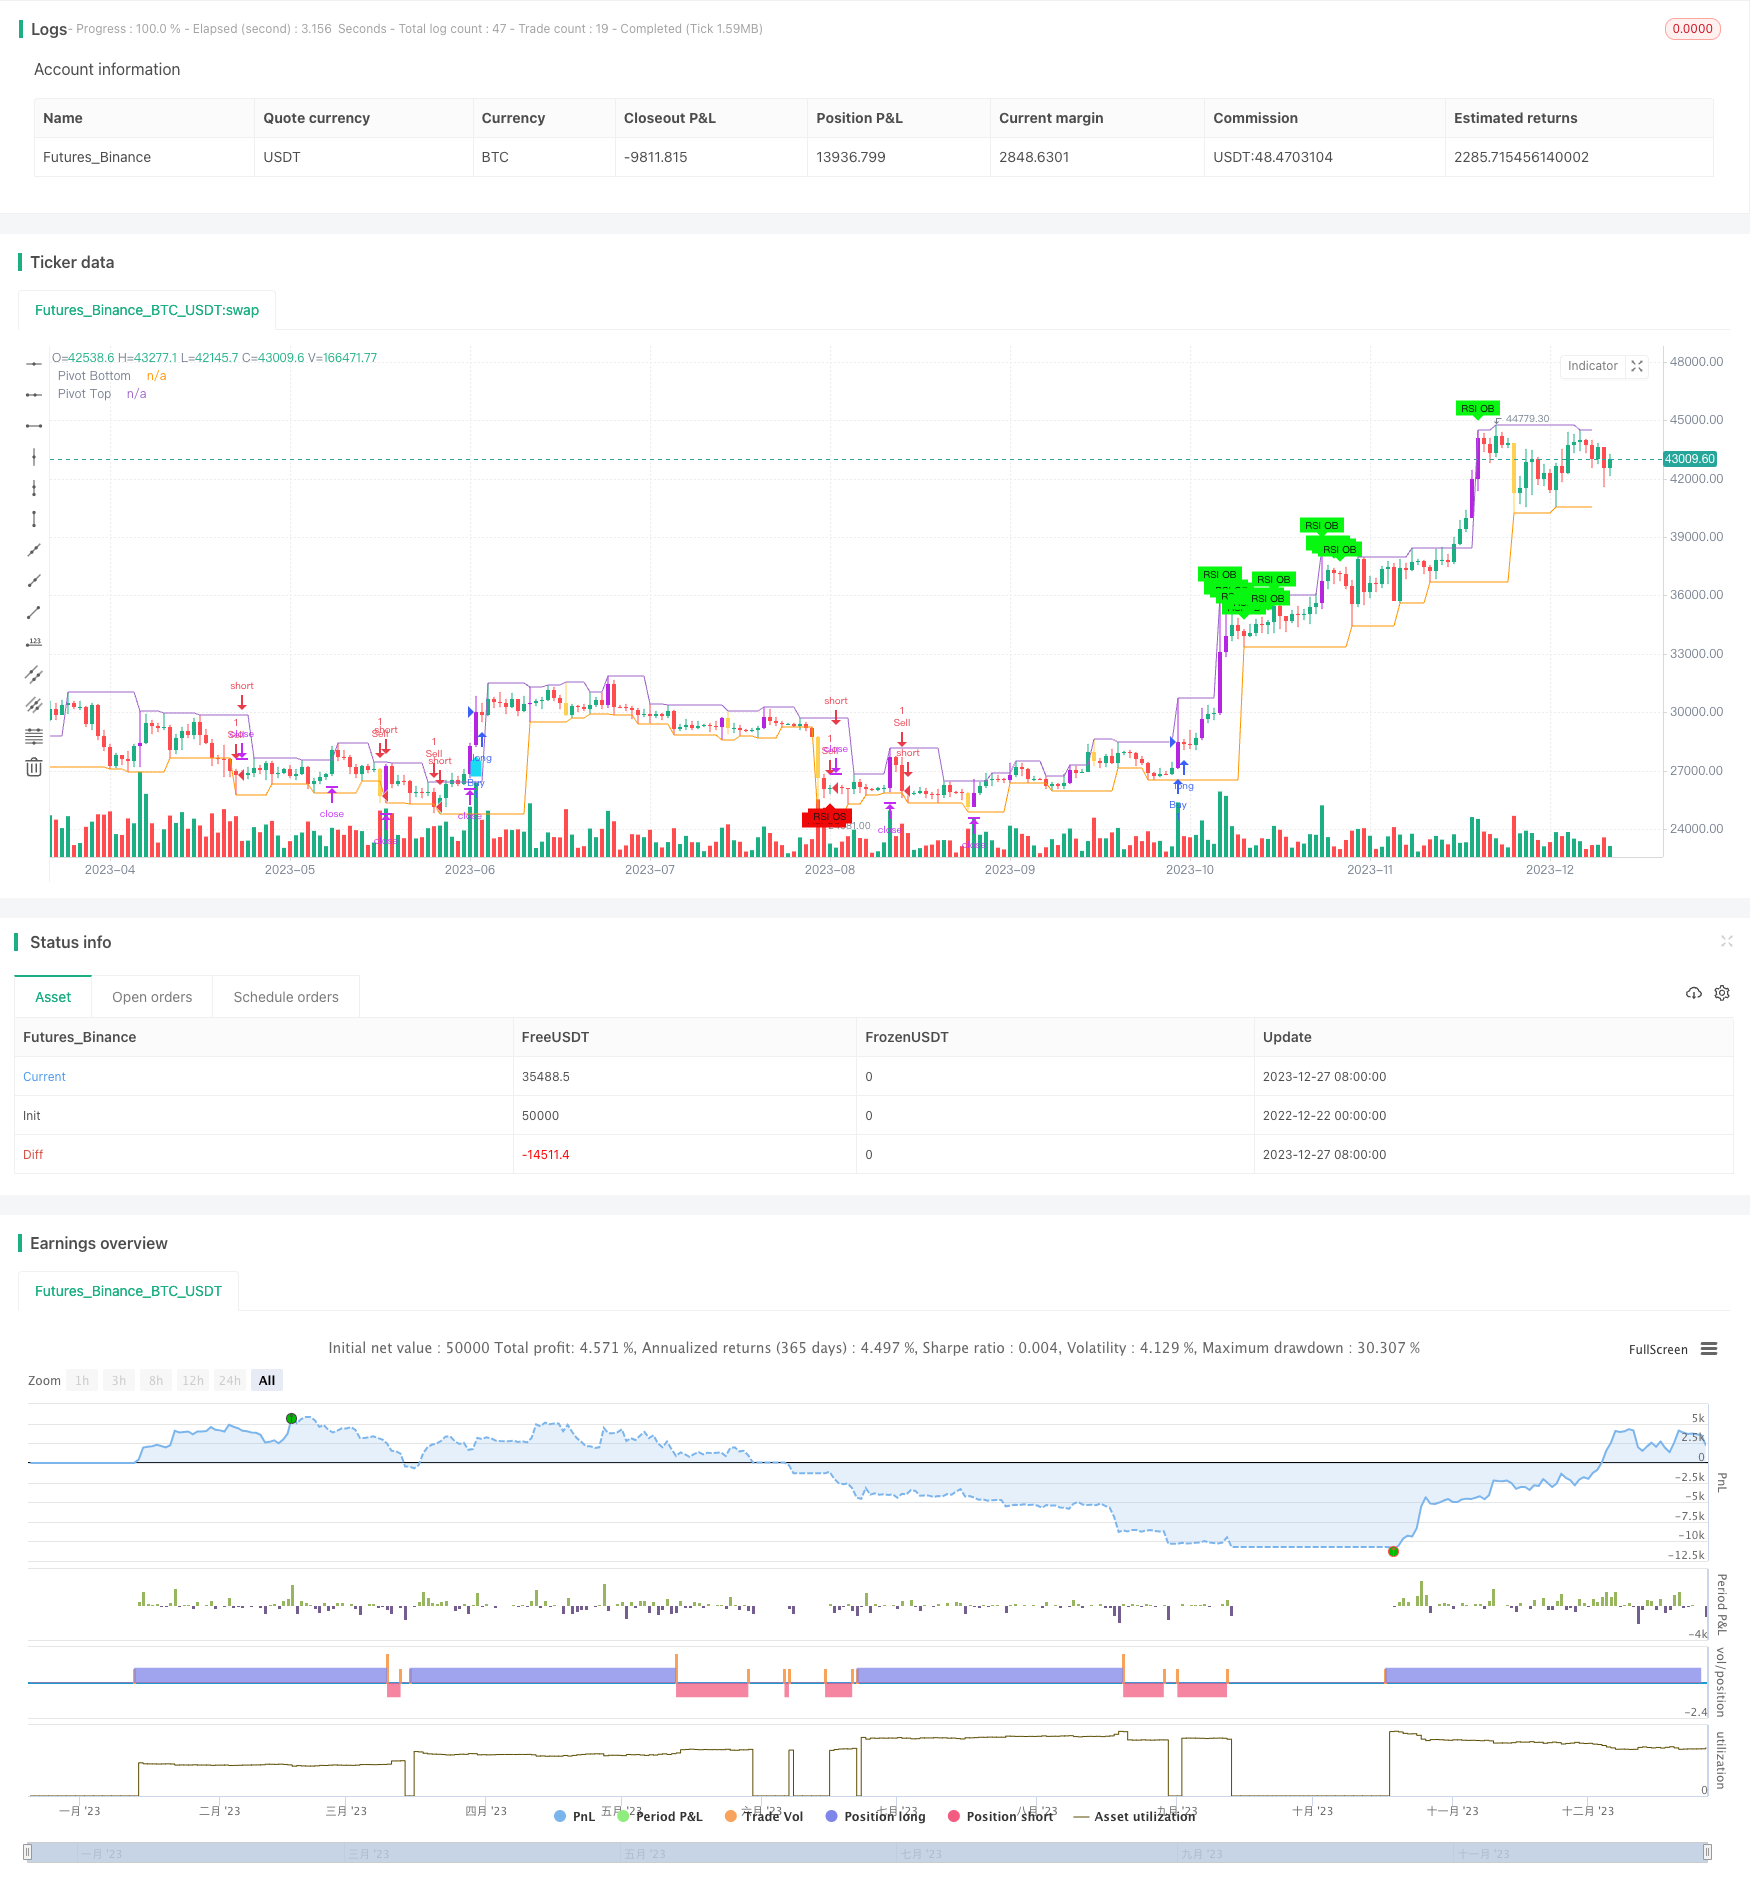
A estratégia combina vários indicadores técnicos, como RSI, ADX, ATR e indicadores de dinâmica, para determinar a tendência e capturar pontos de ruptura. A estratégia também combina a linha de retracção de Fibonacci e a linha média para aumentar ainda mais a precisão de julgamento de pontos-chave e tendências.
Princípio da estratégia
Os indicadores RSI, ADX, DI+, DI- e outros indicam a direção e a força da tendência. O RSI pode refletir sobrecompra e sobrevenda, o ADX reflete a força da tendência e o DI+/DI- determina a tendência de cabeça e cabeça.
Combinando a linha de equilíbrio para determinar a direção da tendência. Usando os EMAs de 5 e 9 para determinar a tendência de curto prazo, a WMA de 21 para determinar a tendência de médio prazo e a WMA de 60 para determinar a tendência de longo prazo.
Utilize a linha de retração de Fibonacci para encontrar pontos de suporte críticos, como 0,5, 0,618. Estes pontos são frequentemente potenciais pontos de reversão.
Defina um preço de parada baseado no ATR e no Stop Loss Ratio para controlar o risco. Defina um preço de parada baseado no ATR e no Stop Loss Ratio para bloquear o lucro.
Quando surgir um sinal de RSI de sobrevenda e sobrevenda, considere a reversão de entrada. Quando a média curta-metragem atravessa a média média do curto prazo e o volume de negociação aumenta, considere a entrada de seguimento da tendência. Depois de entrar no sinal, configure um stop loss e um stop stop.
Análise de vantagens
A utilização de vários indicadores para avaliar a direção e a intensidade das tendências aumenta a precisão da tomada de decisão.
O ATR é um mecanismo de prevenção de danos baseado em um mecanismo de prevenção de danos que controla os riscos de forma eficaz.
Combinado com os pontos-chave de Fibonacci, aumenta a precisão do julgamento do ponto de inflexão.
O volume de transações aumentou como condição auxiliar para acompanhar a tendência e evitar falsas rupturas.
A tabela mostra de forma intuitiva os valores atuais de vários indicadores, facilitando o julgamento e a tomada de decisões rápidas.
Análise de Riscos
A probabilidade de um indicador emitir um sinal de erro não pode ser totalmente evitada, o que pode levar a um risco de operação errada. Os parâmetros do indicador podem ser otimizados através do ajuste dos parâmetros.
A ATR e a proporção de paragem de perda afetam o ponto de paragem real. A proporção que é muito grande ou pequena traz um certo risco e precisa de uma configuração de compensação.
O aumento do volume de transações como condição de entrada também não pode evitar completamente a ocorrência de falsas rupturas, que precisam ser julgadas em combinação com os detalhes da situação dos preços.
O ponto de Fibonacci também não é 100% confiável, e o preço pode atravessar diretamente através dele.
Direção de otimização
Testar e otimizar os parâmetros RSI, ADX, ATR e outros para encontrar a melhor combinação de parâmetros.
Testar diferentes combinações de equilíbrio para determinar quais combinações de equilíbrio são melhores para determinar o efeito da tendência.
Teste diferentes parâmetros de stop loss e stop loss para encontrar o parâmetro que oferece os melhores retornos de risco.
Pode-se considerar a inclusão do indicador BollingerBands para determinar o aumento do volume de transações.
Resumir
Esta estratégia utiliza vários meios técnicos, como o julgamento de tendências, o julgamento de pontos-chave, a análise de volume de negociação e outros. Através da otimização de parâmetros, a precisão e a rentabilidade do julgamento são ainda melhoradas. A configuração de stop loss controla o risco e maximiza a rentabilidade.
/*backtest
start: 2022-12-22 00:00:00
end: 2023-12-28 00:00:00
period: 1d
basePeriod: 1h
exchanges: [{"eid":"Futures_Binance","currency":"BTC_USDT"}]
*/

// This source code is subject to the terms of the Mozilla Public License 2.0 at https://mozilla.org/MPL/2.0/
// © amit74sharma135

//@version=5

strategy(" KritikSharma Strategy for NIFTY,BNIFTY,NG,CRUDE,WTICrude,BTC,GOLD,SILVER,COPPER", overlay=true)
plotHVB = input.bool(defval=true, title='Plot HVB')
plotPVT = input.bool(defval=false, title='Plot Pivots')
hvbEMAPeriod = input.int(defval=12, minval=1, title='Volume EMA Period')
hvbMultiplier = input.float(defval=1.5, title='Volume Multiplier')
pivotLookup = input.int(defval=2, minval=1, maxval=15, title='Pivot Lookup')
ShowAvg1 = input(false, title="Show trend line", group="TREND LINE Moving Average", tooltip="Display a trend line based on EMA.")
showLines1 = input.bool(defval=false, title="Draw EMA,WMA Line")
ema200_length= input.int(defval=200, minval=1, maxval=500, title='ema1')
ema300_length= input.int(defval=300, minval=1, maxval=500, title='ema2')
wma60_length= input.int(defval=60, minval=1, maxval=100, title='wma60')
ema5 = ta.ema(close, 5)
ema9 = ta.ema(close, 9)
wma21=ta.wma(close,21)
wma60=ta.wma(close,wma60_length)
len1 = input.int(11, minval=1, maxval=500, title="Length", group="TREND LINE Moving Average", tooltip="Set EMA length.")
ema=ta.ema(close, len1)
rsiLength = input.int(14, title="RSI Length", minval=1, maxval=50, group="Table ADX, RSI, DI values with Red, Green, Yellow Signal")
adxLength = input.int(14, title="ADX Length", minval=1, maxval=50, group="Table ADX, RSI, DI values with Red, Green, Yellow Signal")
adxThreshold = input.int(20, title="ADX Threshold", group="Table ADX, RSI, DI values with Red, Green, Yellow Signal")
diThreshold = input.int(25, title="DI Threshold", group="Table ADX, RSI, DI values with Red, Green, Yellow Signal")
atr = input.int(14, title="ATR values", group="Table ADX, RSI, DI values with Red, Green, Yellow Signal")
////////////////////////////////////////////////

hvbBullColor = color.rgb(181, 37, 225)
hvbBearColor = #ffbb00ad

pvtTopColor = color.new(#154bef, 0)
pvtBottomColor = color.new(#b81657, 0)

//////////////////// Pivots ////////////////////
hih = ta.pivothigh(high, pivotLookup, pivotLookup)
lol = ta.pivotlow(low , pivotLookup, pivotLookup)
top1 = ta.valuewhen(hih, high[pivotLookup], 0)
bottom1 = ta.valuewhen(lol, low [pivotLookup], 0)
plot(top1, offset=-pivotLookup, linewidth=1, color=(top1 != top1[1] ? na : (plotPVT ? pvtTopColor : na)), title="Pivot Top")
plot(bottom1, offset=-pivotLookup, linewidth=1, color=(bottom1 != bottom1[1] ? na : (plotPVT ? pvtBottomColor : na)), title="Pivot Bottom")

//////////////////////////////////////Functions
isUp(index) =>
    close[index] > open[index]

isDown(index) =>
    close[index] < open[index]

isObUp(index) =>
    isDown(index + 1) and isUp(index) and close[index] > high[index + 1]

isObDown(index) =>
    isUp(index + 1) and isDown(index) and close[index] < low[index + 1]
////////////////// High Volume Bars //////////////////
volEma = ta.ema(volume, hvbEMAPeriod)
isHighVolume = volume > (hvbMultiplier * volEma)
barcolor(plotHVB and isUp(0) and isHighVolume ? hvbBullColor : na, title="Bullish HVB")
barcolor(plotHVB and isDown(0) and isHighVolume ? hvbBearColor : na, title="Bearish HVB")

// Calculate ADX, DI+,  DI-,RSI,ATR
[diplus, diminus, adx] = ta.dmi(adxLength, adxThreshold)
rsi=ta.rsi(close,rsiLength)
atrValue=ta.atr(atr)

// Check for oversold,Overbought condition
oversold_condition = rsi < 20
overbought_condition = rsi > 80

// Plot Trend Line
trendColor = ema5 > ema9 ? color.rgb(22, 203, 28) : ema5 < ema9 ? color.rgb(224, 15, 15) : na
plot(ShowAvg1? ema:na, color=trendColor, linewidth=6, title="Trend Line Upper Ribbon")

/////////////////////////plot ema,wma
plot(showLines1 ? ta.ema(close, ema200_length) : na, color=color.rgb(102, 110, 103), style=plot.style_line, title="ema1",linewidth = 4)
plot(showLines1 ? ta.ema(close, ema300_length) : na, color=color.rgb(18, 20, 18), style=plot.style_line, title="ema2",linewidth = 4)
plot(showLines1 ? ta.wma(close, wma60_length) : na, color=color.rgb(238, 75, 211), style=plot.style_line, title="wma60",linewidth = 3)

// Plot signals with smaller text
plotshape(oversold_condition ? 1 : na, title="RSI Oversold Signal", color=color.rgb(238, 8, 8), style=shape.labelup, location=location.belowbar, text="RSI OS", textcolor=color.rgb(17, 17, 17), size=size.tiny)
plotshape(overbought_condition ? 1 : na, title="RSI Overbought Signal", color=#08f710, style=shape.labeldown, location=location.abovebar, text="RSI OB", textcolor=color.rgb(8, 8, 8), size=size.tiny)
///////////////////////////////////////////////////////////////////////////////////////////////

// Define input options
showTable = input(false, title="Show Table ADX, RSI, DI values with RED, GREEN and YELLOW Signal")
tablePosition = input.string("Top Right", title="Table Position", options=["Top Right", "Top Left", "Top Center", "Bottom Right", "Bottom Left", "Bottom Center"])

// Define colors for the table cells
colorRsi = rsi > 55 ? color.green : rsi < 45 ? color.red : color.yellow
colorDiPlus = diplus > diThreshold ? color.green : color.red
colorDiMinus = diminus > diThreshold ? color.red : color.green
colorAdx = (rsi < 45 and diplus < diThreshold and diminus > diThreshold and adx > adxThreshold) ? color.red :
           (rsi > 55 and diplus > diThreshold and diminus < diThreshold and adx > adxThreshold) ? color.green :
           color.yellow

// Create the table
var table testTable = na
if showTable
    var position = tablePosition == "Top Right" ? position.top_right :
                   tablePosition == "Top Left" ? position.top_left :
                   tablePosition == "Top Center" ? position.top_center :
                   tablePosition == "Bottom Right" ? position.bottom_right :
                   tablePosition == "Bottom Left" ? position.bottom_left :
                   position.bottom_center

    testTable := table.new(position, columns = 4, rows = 2, border_width = 1, border_color = color.black, frame_width = 1, frame_color = color.black)

    // Column Headings
    table.cell(table_id = testTable, column = 0, row = 0, text = " DI+ ", bgcolor=color.aqua, text_color = color.white)
    table.cell(table_id = testTable, column = 1, row = 0, text = " DI- ", bgcolor=color.aqua, text_color = color.white)
    table.cell(table_id = testTable, column = 2, row = 0, text = " ADX ", bgcolor=color.aqua, text_color = color.white)
    table.cell(table_id = testTable, column = 3, row = 0, text = " RSI ", bgcolor=color.aqua, text_color = color.white)

    // Column values
    table.cell(table_id = testTable, column = 0, row = 1, text = str.tostring(math.round(diplus, 0)), bgcolor=colorDiPlus, text_color = color.black)
    table.cell(table_id = testTable, column = 1, row = 1, text = str.tostring(math.round(diminus, 0)), bgcolor=colorDiMinus, text_color = color.black)
    table.cell(table_id = testTable, column = 2, row = 1, text = str.tostring(math.round(adx, 0)), bgcolor=colorAdx, text_color = color.black)
    table.cell(table_id = testTable, column = 3, row = 1, text = str.tostring(math.round(rsi, 0)), bgcolor=colorRsi, text_color = color.black)


// Initialize variables to keep track of the previous condition
var bool prev_oversold = na
var bool prev_overbought = na

plotshape(ta.crossover(ema,wma60) and isHighVolume,  style=shape.labelup, location=location.belowbar, color=#1adaf3,size=size.small)
plotshape(ta.crossunder(ema,wma60) and isHighVolume,  style=shape.labeldown, location=location.abovebar, color=#f30aa9, size=size.small)
//////////////////////////////////////////////////
plotFibRetracement = input.bool(title="Plot Fibonacci Retracement", defval=false)
fibLevel1 = input.float(title="Fibonacci Level", defval=0.5, minval=0, maxval=1, step=0.01)
fibLevel2 = input.float(title="Fibonacci Level", defval=0.618, minval=0, maxval=1, step=0.01)
fibLevel3 = input.float(title="Fibonacci Level", defval=0.368, minval=0, maxval=1, step=0.01)
// Calculate Fibonacci Levels
highPrice = ta.highest(high, 100)
lowPrice = ta.lowest(low, 100)
priceRange = highPrice - lowPrice
fibonacciLevel1 = lowPrice + priceRange * fibLevel1
fibonacciLevel2 = lowPrice + priceRange * fibLevel2
fibonacciLevel3 = lowPrice + priceRange * fibLevel3

// Plot Fibonacci Levels
if plotFibRetracement
    line.new(x1=bar_index[1], y1=fibonacciLevel1, x2=bar_index, y2=fibonacciLevel1, color=color.blue, width=2)
    line.new(x1=bar_index[1], y1=fibonacciLevel2, x2=bar_index, y2=fibonacciLevel2, color=color.blue, width=2)
    line.new(x1=bar_index[1], y1=fibonacciLevel3, x2=bar_index, y2=fibonacciLevel3, color=color.blue, width=2)
// Draw Trendline
var float trendlineY1 = na
var float trendlineY2 = na

if bar_index % 50 == 0
    trendlineY1 := low
    trendlineY2 := high

// line.new(x1=bar_index, y1=trendlineY1, x2=bar_index - 100, y2=trendlineY2, color=#3708a5, width=2)

////////////////////////////////////////////////entry, exit, profit booking, stoploss///////////////////////
if (rsi > 63 and adx> adxThreshold and diplus>diThreshold)
    strategy.entry("Buy", strategy.long, qty = 1)

if (rsi < 40 and adx> adxThreshold and diminus>diThreshold)
    strategy.entry("Sell", strategy.short, qty = 1)

// Set stop loss and take profit levels
stop_loss = input(1.5, title = "Stop Loss (%)") * atrValue
take_profit = input(4.0, title = "Take Profit (%)") * atrValue
strategy.exit("Take Profit/Stop Loss", from_entry = "Buy", stop = close - stop_loss, limit = close + take_profit)
strategy.exit("Take Profit/Stop Loss", from_entry = "Sell", stop = close + stop_loss, limit = close - take_profit)
////////////////////////