Estratégia de Trailing Stop Loss de Bohr Band ATR
Visão geral
Esta estratégia combina o uso do indicador de bols bands e o indicador de média real amplitude (ATR) para formar uma estratégia de negociação de ruptura com função de parada de perdas de seguimento. Quando o preço atravessa a banda de bols com um padrão especificado de diferença, um sinal de negociação é emitido.
Princípio da estratégia
O primeiro passo é calcular a trajectória média, a trajectória superior e a trajectória inferior. A trajectória média é o SMA do preço e a trajectória superior e inferior é o número inteiro da diferença padrão entre os preços. Quando o preço se move para cima a partir da trajectória inferior, faça mais; quando se move para baixo a partir da trajectória superior, faça zero.
O segundo passo é calcular o indicador ATR. O indicador ATR reflete a amplitude média de flutuação do preço. De acordo com o valor do ATR, configure o ponto de parada de posição longa e o ponto de parada de posição curta.
O terceiro passo é usar o filtro de tempo para negociar apenas nos períodos de tempo indicados, evitando a forte volatilidade de eventos de grande importância.
Quarta etapa, o mecanismo de trailing stop. De acordo com a posição mais recente do ATR, ajuste o ponto de parada em tempo real para bloquear mais lucros.
Análise de vantagens
O Bollinger Bands, por si só, reflete a centralidade dos preços de forma mais eficiente do que uma média móvel única.
O ATR Stop Loss permite que o risco seja controlado de forma eficaz em cada taxa de ganho e perda.
O trailing stop pode ser ajustado automaticamente para oscilações do mercado e bloquear mais lucros;
Uma combinação personalizada com uma variedade de parâmetros de estratégia.
Análise de Riscos
A tendência é para que haja pequenos prejuízos quando os mercados são ajustados por grandes turbulências.
O que é que os russos estão a fazer?
A noite e os momentos de grande notícia são perigosos e devem ser evitados.
Resposta:
- A rigorosa aplicação dos princípios de gestão de riscos e controlo dos prejuízos individuais;
- Otimizar os parâmetros e aumentar a taxa de vitórias;
- Utilize filtros de tempo para evitar períodos de alto risco.
Direção de otimização
- Teste de configurações de otimização de diferentes combinações de parâmetros
- Aumentar o indicador de calor como OBV quando selecionado
- Adicionar otimizadores de módulos de aprendizagem de máquina
Resumir
Esta estratégia usa um conjunto de indicadores de Bolus para determinar o centro de tendência e a direção da ruptura, o indicador ATR para calcular o stop loss para garantir o lucro e o lucro, e o stop loss para bloquear o lucro. A vantagem da estratégia é que ela é altamente personalizável, pode controlar o risco e é adequada para a linha curta.
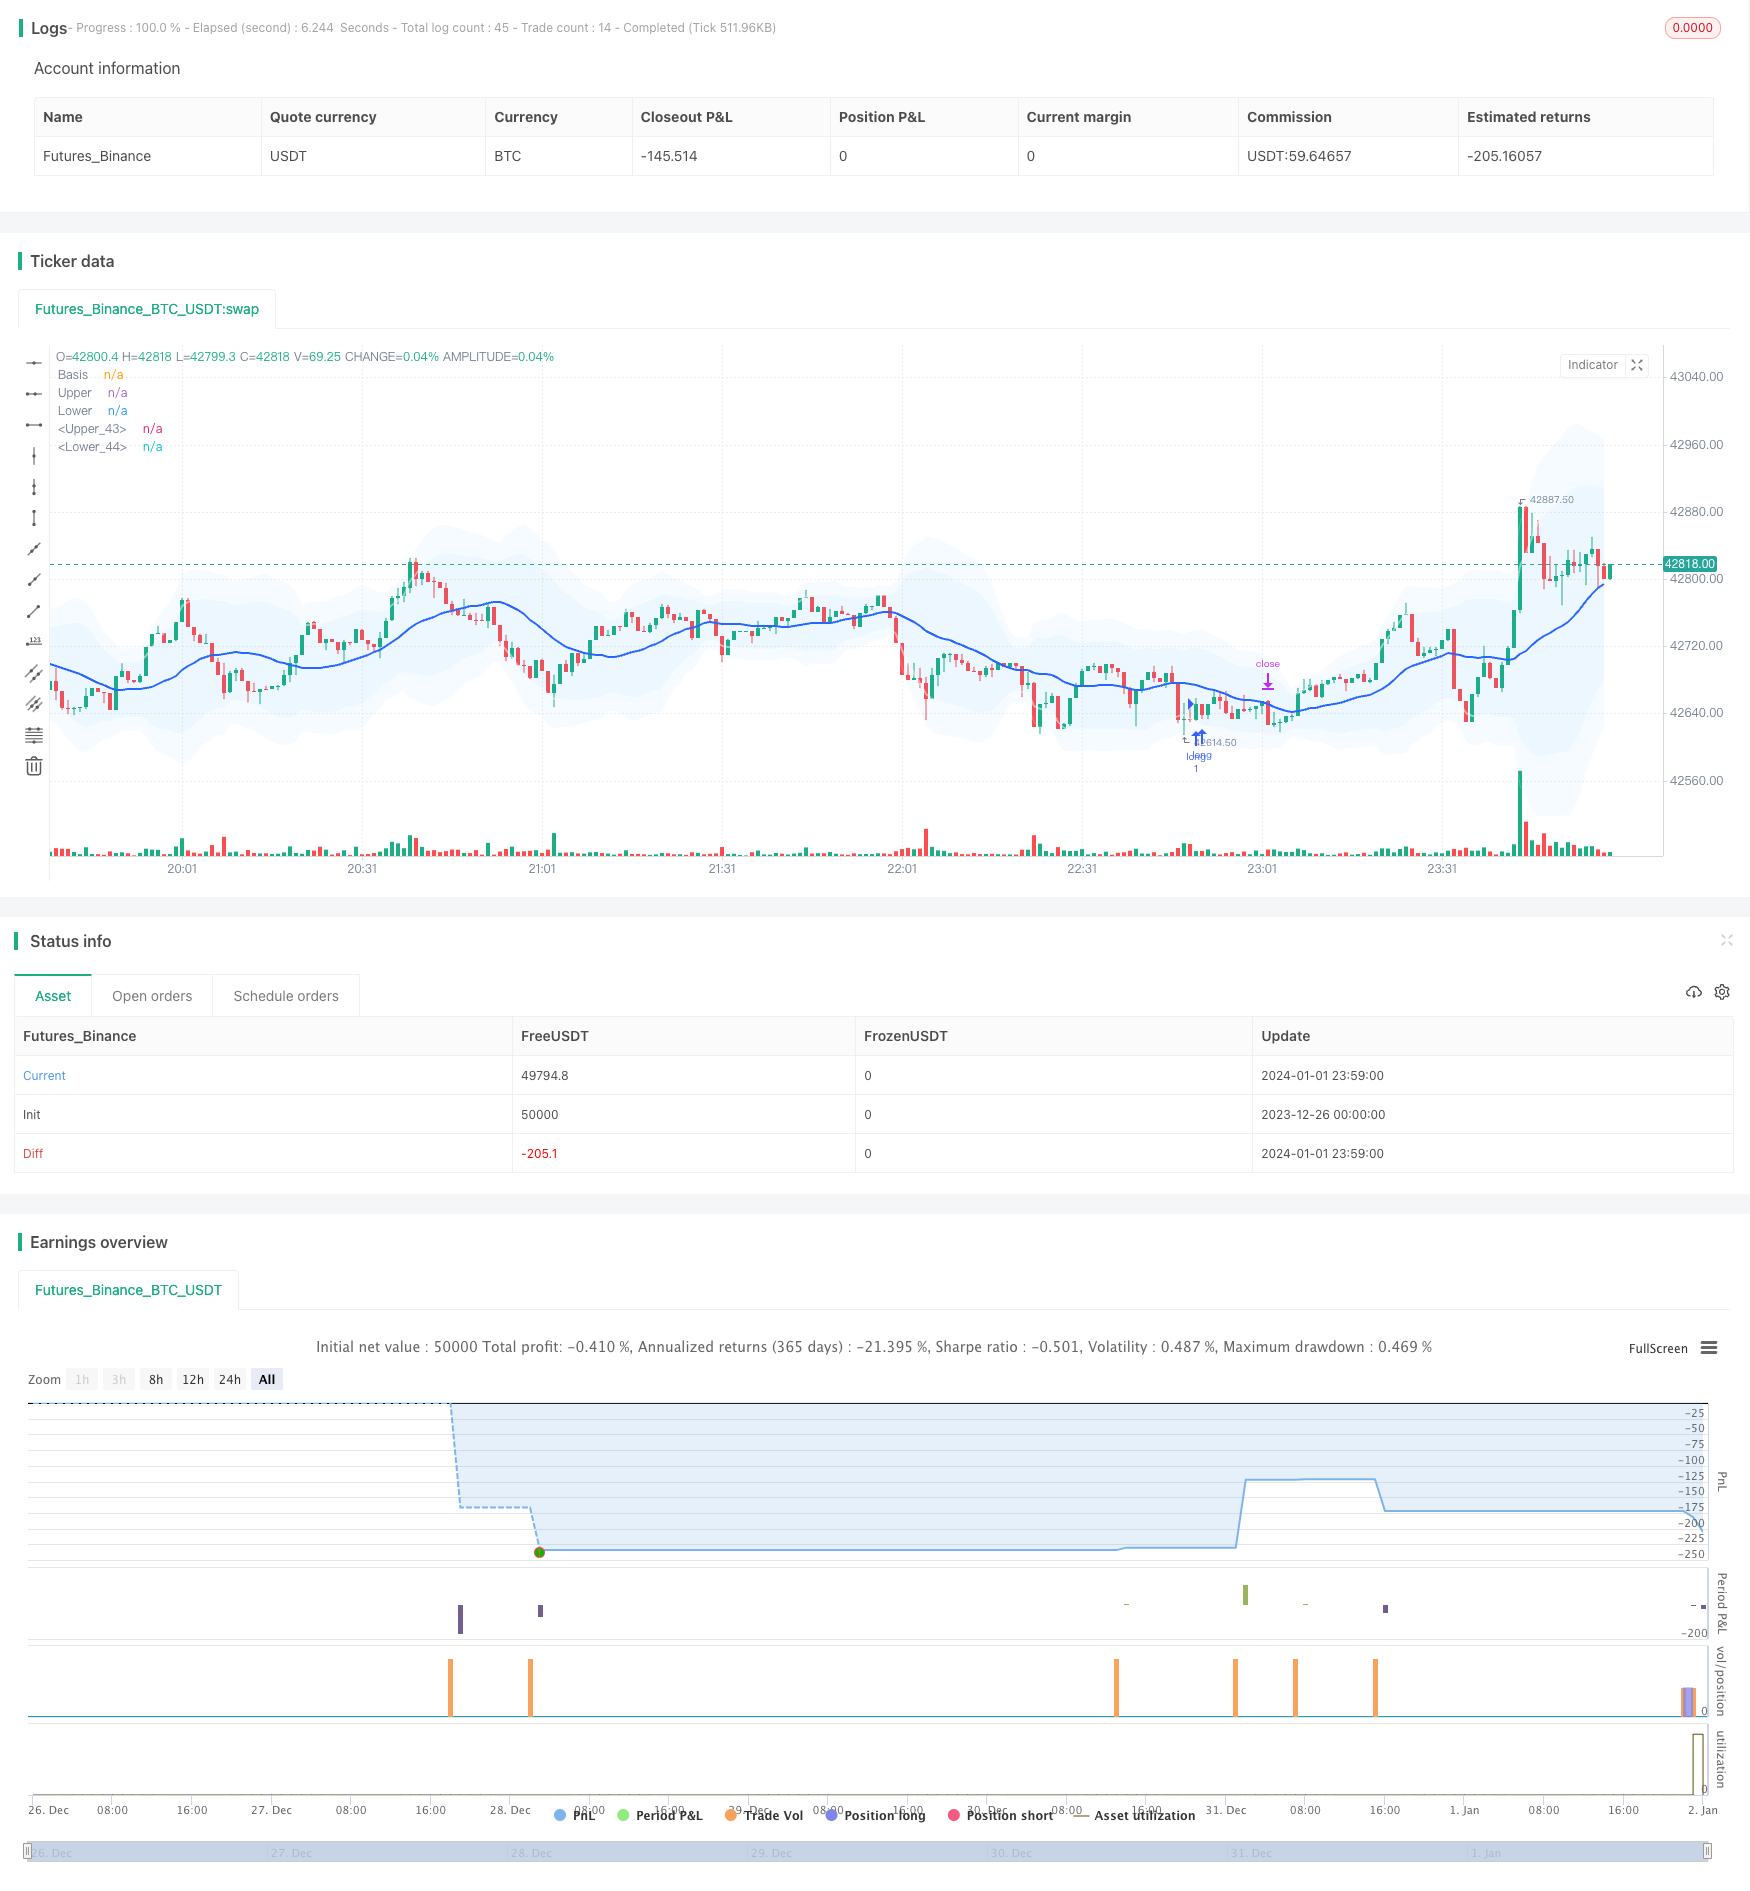
/*backtest
start: 2023-12-26 00:00:00
end: 2024-01-02 00:00:00
period: 1m
basePeriod: 1m
exchanges: [{"eid":"Futures_Binance","currency":"BTC_USDT"}]
*/

// This source code is subject to the terms of the Mozilla Public License 2.0 at https://mozilla.org/MPL/2.0/
// © sadeq_haddadi

//@version=5

strategy('Bollinger Bands + ATR / trail- V2', overlay=true ) // Interactive Brokers rate)


//date and time
startDate   = input(title="Start Date", defval=timestamp("01 Aug 2023 00:00 +0000"), tooltip="Date & time to begin analysis",group = 'Time Filter')
endDate     = input(title="End Date", defval=timestamp("1 Jan 2099 00:00 +0000"), tooltip="Date & time to stop analysis")
timeSession = input(title="Time Session To Analyze", defval="0300-1700", tooltip="Time session to analyze")
inSession(sess) => true

// indicators

length = input.int(20, minval=1,group = 'Bollinger Band')
maType = input.string("SMA", "Basis MA Type", options = ["SMA", "EMA", "SMMA (RMA)", "WMA", "VWMA"])
src = input(close, title="Source")
mult1 = input.float(2.0, minval=0.001, maxval=50, title="StdDev1")
mult2 = input.float(3.0, minval=0.001, maxval=50, title="StdDev2")

ma(source, length, _type) =>
    switch _type
        "SMA" => ta.sma(source, length)
        "EMA" => ta.ema(source, length)
        "SMMA (RMA)" => ta.rma(source, length)
        "WMA" => ta.wma(source, length)
        "VWMA" => ta.vwma(source, length)

basis = ma(src, length, maType)
dev1 = mult1 * ta.stdev(src, length)
dev2 = mult2 * ta.stdev(src, length)
upper1 = basis + dev1
lower1 = basis - dev1
upper2 = basis + dev2
lower2 = basis - dev2
offset = input.int(0, "Offset", minval = -500, maxval = 500)
plot(basis, "Basis", color=#2962FF, offset = offset,linewidth=2)
p1 = plot(upper1, "Upper", color=color.new(color.white,50), offset = offset,linewidth=2)
p2 = plot(lower1, "Lower", color=color.new(color.white,50), offset = offset,linewidth=2)
p3 = plot(upper2, "Upper", color=color.new(color.white,80), offset = offset,linewidth=1)
p4 = plot(lower2, "Lower", color=color.new(color.white,80), offset = offset,linewidth=1)

fill(p1, p2, title = "Background", color=color.rgb(33, 150, 243, 95))
fill(p3, p4, title = "Background", color=color.rgb(33, 150, 243, 95))

show_crosses = input(false, "Show Cross the Bands?")

plotshape(show_crosses and ta.crossover(close, upper2)  ? src : na, "S", style = shape.triangledown, location =location.abovebar, color = color.yellow, size = size.tiny)
plotshape(show_crosses and ta.crossunder(low, lower2) ? src : na ,"L", style = shape.triangleup, location =  location.belowbar, color = color.purple, size = size.tiny)

second_entry = input(true, "Show second deviation entry point?")

//atr

length_ATR = input.int(title="Length", defval=5, minval=1,group = 'ATR')
smoothing = input.string(title="Smoothing", defval="RMA", options=["RMA", "SMA", "EMA", "WMA"])
m = input.float(1, "Multiplier")
src1 = input(high)
src2 = input(low)
pline = input.bool(title = 'show ATR lines ?', defval=false)


ma_function(source, length_ATR) =>
	if smoothing == "RMA"
		ta.rma(source, length_ATR)
	else
		if smoothing == "SMA"
			ta.sma(source, length_ATR)
		else
			if smoothing == "EMA"
				ta.ema(source, length_ATR)
			else
				ta.wma(source, length_ATR)

a = ma_function(ta.tr(true), length_ATR) * m
x = ma_function(ta.tr(true), length_ATR) * m + src1
x2 = src2 - ma_function(ta.tr(true), length_ATR) * m

PP1 = plot(pline ? x :na , title = "ATR Short Stop Loss", color= color.new(color.red,20) )
PP2 = plot(pline ? x2:na , title = "ATR Long Stop Loss",  color=color.new(color.green,20) )

Tp_to_Sl = input.float(1.5, "TP/SL")
candle_size =  input.float(10, "candle/pip")
distance_source =  input.float(1.5, "distance to midline/pip")
//strategy

buyCondition = low[2] < lower1 and  ta.crossover(close[1], lower1)  and strategy.position_size == 0 and (close[1] - open[1]) < candle_size * 0.0001 and close > open and ( basis - close) > distance_source * 0.0001

sellCondition = high[2] > upper1 and ta.crossunder(close[1], upper1)  and strategy.position_size == 0 and (open[1] - close[1]) < candle_size * 0.0001 and close < open  and (close - basis) > distance_source * 0.0001
//
buyCondition2 = low[2] < lower2 and  ta.crossover(close[1], lower2)  and (close[1] - open[1]) < candle_size * 0.0001 and close > open and ( basis - close) > distance_source * 0.0001
sellCondition2 = high[2] > upper2 and ta.crossunder(close[1], upper2)   and (open[1] - close[1]) < candle_size * 0.0001 and close < open  and (close - basis) > distance_source * 0.0001

plotshape(second_entry and  sellCondition2 ? src : na, "S", style = shape.triangledown, location =location.abovebar, color = color.rgb(241, 153, 177), size = size.tiny)
plotshape(second_entry and buyCondition2 ? src : na ,"L", style = shape.triangleup, location =  location.belowbar, color = color.rgb(177, 230, 168), size = size.tiny)
//
since_buy  =ta.barssince(buyCondition)
since_sell =ta.barssince(sellCondition)
entry_price = ta.valuewhen(buyCondition or sellCondition, src, 0)

sl_long = ta.valuewhen(buyCondition, x2[1], 0)
sl_short = ta.valuewhen(sellCondition, x[1], 0)
buyprofit = entry_price + (Tp_to_Sl*( entry_price - sl_long))
sellprofit= entry_price + (Tp_to_Sl*( entry_price - sl_short))

//alert_massage = "new strategy position is {{strategy.position_size}}"
//prof = ta.crossover(high,upper1)
//buyexit=ta.valuewhen(prof,upper1,0)

if buyCondition and inSession(timeSession)

    strategy.entry( id = "long", direction = strategy.long , alert_message='Open Long Position' )

if sellCondition and inSession(timeSession)

    strategy.entry(id= "short", direction = strategy.short, alert_message='Open Short Position')

//trail-stop loss
use_trailing = input.bool(title = 'use trailing stop loss?', defval=true)
pricestop_long=0.00
pricestop_short=100000.00
if (strategy.position_size > 0)

    if use_trailing == false
        pricestop_long := sl_long
    else
        pricestop_long := math.max (x2, pricestop_long[1]) //trail - long

if (strategy.position_size < 0)

    if use_trailing == false
        pricestop_short := sl_short
    else
        pricestop_short := math.min (x, pricestop_short[1])  // trail - short

if strategy.position_size > 0

    strategy.exit(id = 'close', limit =  buyprofit , stop = pricestop_long  )

if strategy.position_size < 0

    strategy.exit(id = 'close', limit = sellprofit  , stop = pricestop_short  )

alertcondition(buyCondition or sellCondition, 'Enter_position')