Estratégia de acompanhamento de tendência de média móvel adaptável de Kaufman
Visão geral
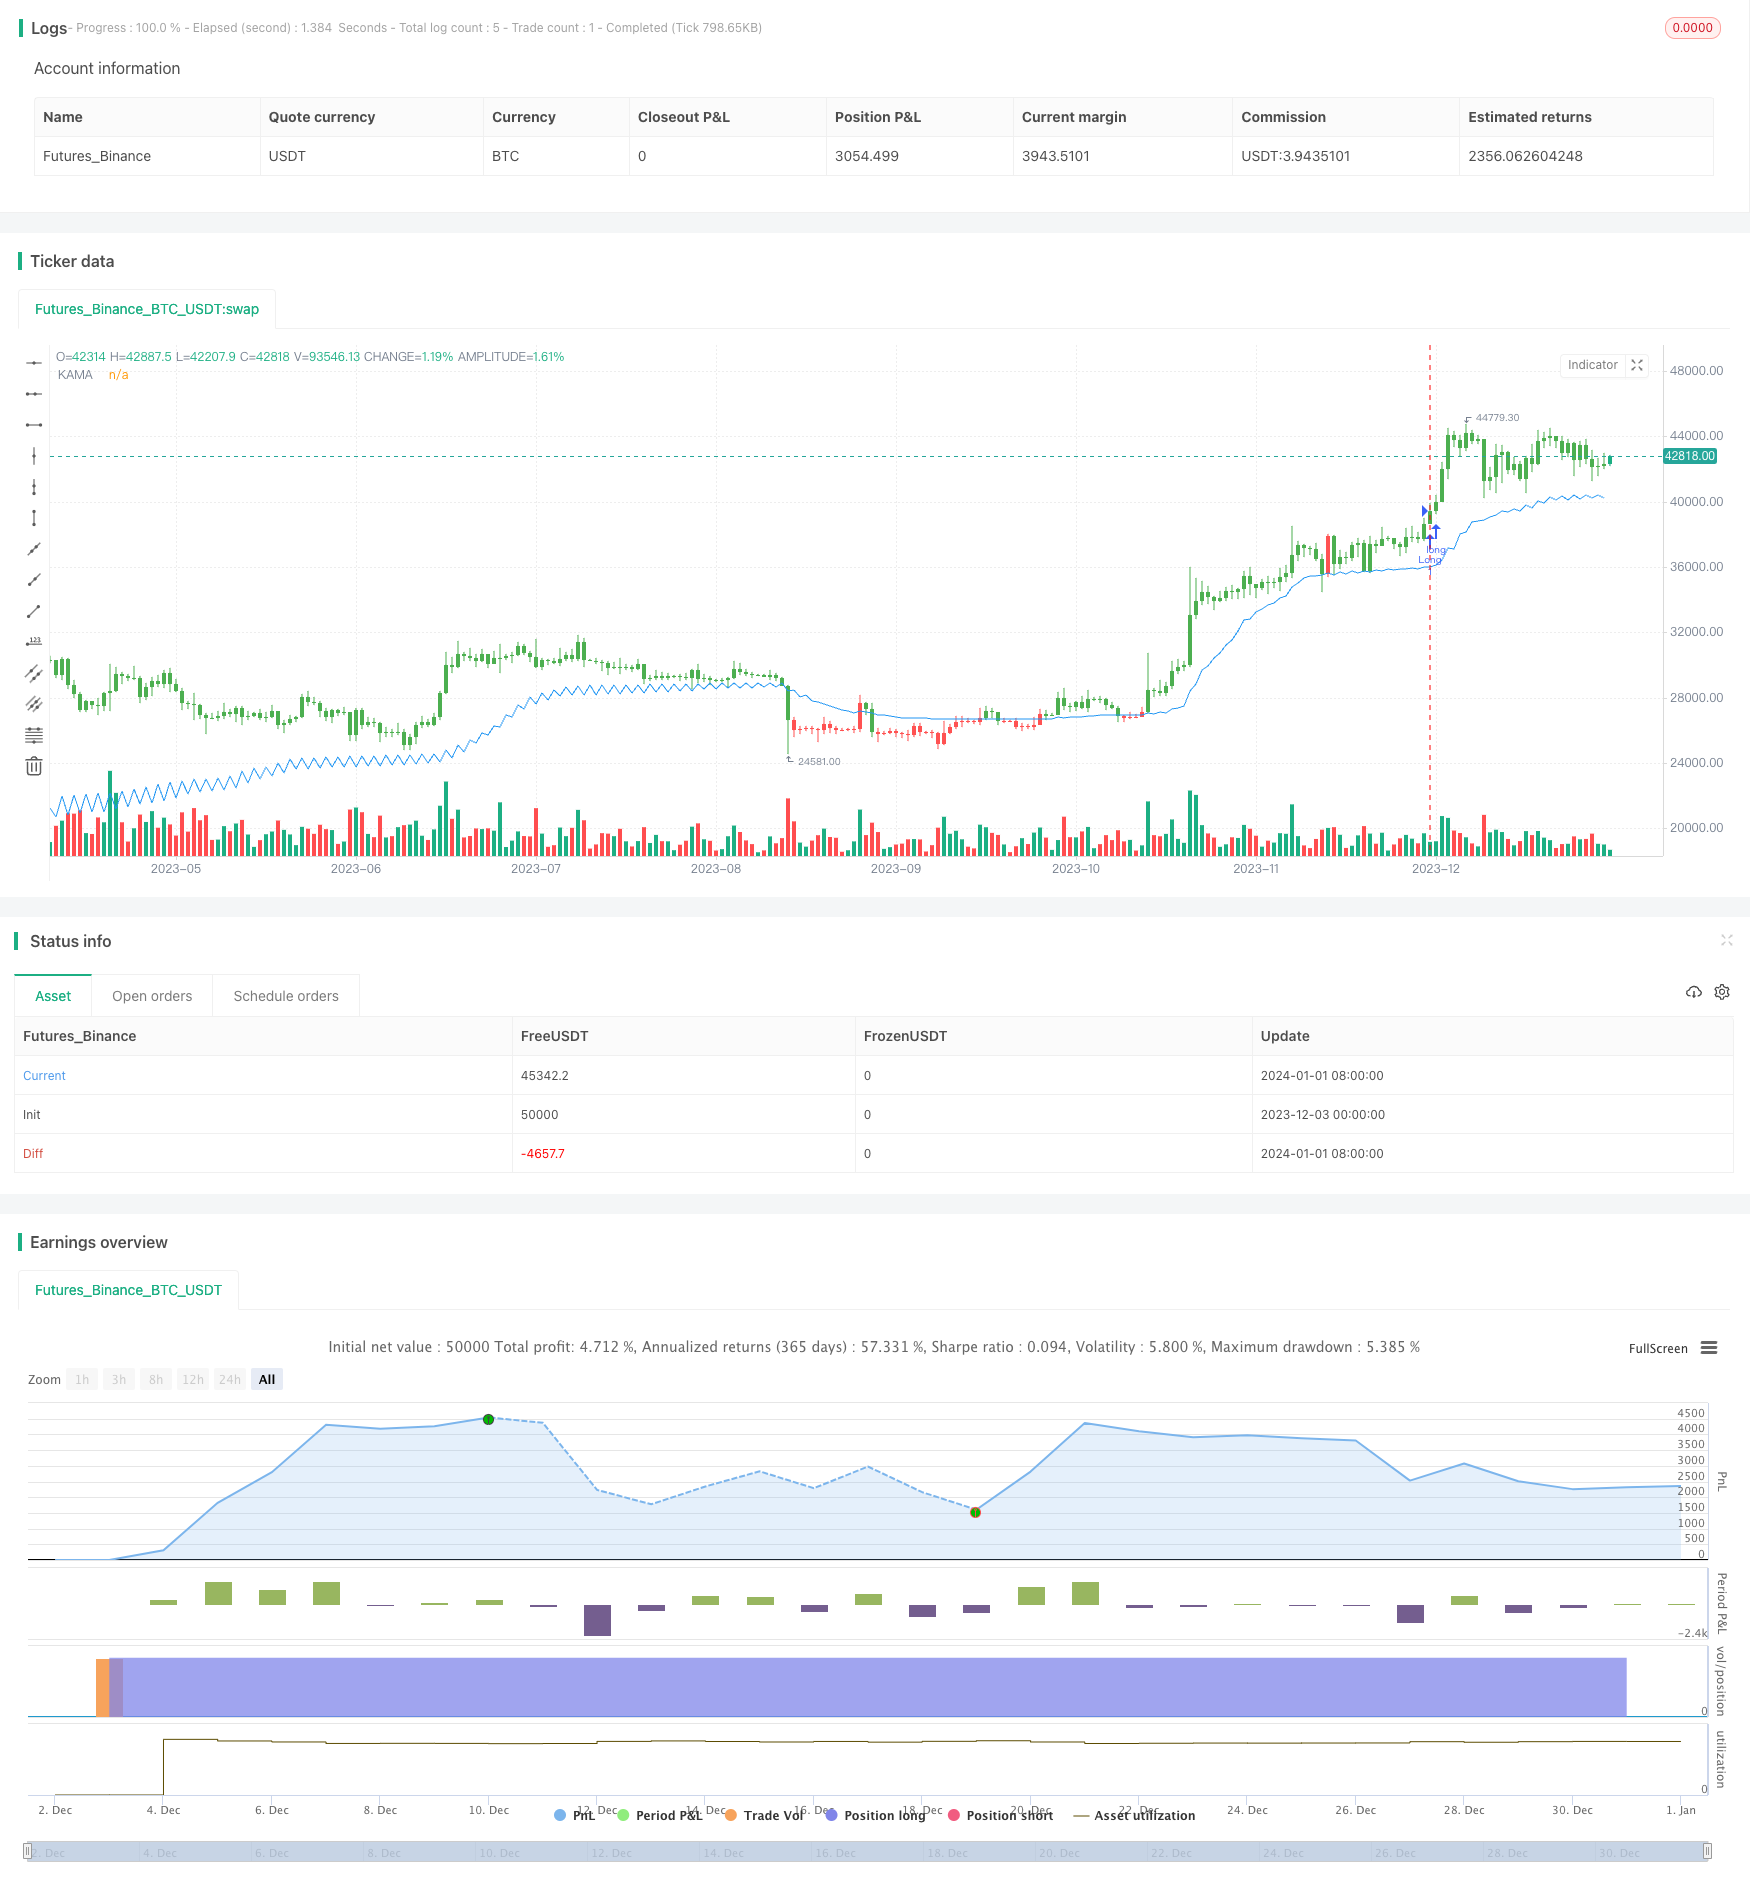
A estratégia usa o indicador de Média Móvel Adaptável Kaufman (KAMA) para acompanhar a tendência de preços, alcançar baixas e altas vendas e lucrar.
Princípio da estratégia
A fórmula de cálculo para o indicador de média móvel adaptada a Kaufman (KAMA) é:
nAMA = nz(nAMA[1]) + nsmooth * (Close - nz(nAMA[1]))

其中:

nsmooth = (nefratio * (nfastend - nslowend) + nslowend)^2

nefratio = nsignal / nnoise

nsignal = |Close - Close[Length]|

nnoise = sum(|Close - Close[1]|, Length)

nfastend = 0.666

nslowend = 0.0645
O conjunto de indicadores leva em consideração a volatilidade do mercado e as tendências de mudança de preços, permitindo um acompanhamento mais rápido das tendências de preços.
- Quando a volatilidade do mercado é menor, o nsmooth se aproxima do nslowend, e a linha KAMA muda lentamente, suprimindo o ruído do mercado.
- Quando a volatilidade do mercado aumenta e uma tendência surge, o nsmooth se aproxima do nfastend, a linha KAMA muda rapidamente e segue a tendência.
Comparando a relação entre o preço e o KAMA, pode-se determinar a direção da tendência do preço e, assim, tomar a decisão de fazer mais decolagem.
Vantagens estratégicas
A maior vantagem da estratégia é que o uso de indicadores de média móvel adaptável para acompanhar as mudanças na tendência dos preços pode efetivamente reduzir o impacto do ruído, e o acompanhamento é eficaz. As vantagens específicas são as seguintes:
- Os indicadores KAMA inibem o ruído do mercado e reduzem a combinação desnecessária de transações.
- O indicador KAMA é capaz de responder rapidamente às mudanças de tendências de preços e de acompanhar os resultados.
- As regras para a tomada de decisões estratégicas são simples, claras, fáceis de entender e implementar.
- Pode ser configurado para negociação reversa, adaptando-se a diferentes ambientes de mercado.
Risco estratégico
A estratégia também apresenta alguns riscos:
- Em situações de turbulência, o indicador KAMA pode apresentar sinais de erro. O efeito do indicador pode ser otimizado através do ajuste dos parâmetros.
- O atraso no acompanhamento pode ter ocorrido, podendo ter-se perdido uma inversão de preço de curto prazo. O diagnóstico pode ser combinado com outros indicadores, se necessário.
- Sem levar em conta as taxas de transação e os pontos de deslizamento, a eficácia do disco rígido é menor do que a da retrospectiva.
Direção de otimização da estratégia
A estratégia também pode ser melhorada nos seguintes aspectos:
- Otimizar os parâmetros KAMA para melhorar a sensibilidade de rastreamento do indicador.
- Aumentar o mecanismo de impedimento de perdas e controlar a perda máxima de uma única transação.
- A combinação de outros indicadores com os sinais de filtragem aumenta a precisão da tomada de decisão.
- Adição de mecanismos de reentrada para acompanhar as tendências.
Resumir
Esta estratégia usa o indicador de média móvel adaptável Kaufman para acompanhar a tendência dos preços, as regras de decisão são simples e claras, a operação em campo é fácil. O indicador é silencioso e responde rapidamente às mudanças de preço, o acompanhamento é bom e é uma estratégia de acompanhamento de tendência recomendada.
/*backtest
start: 2023-12-03 00:00:00
end: 2024-01-02 00:00:00
period: 1d
basePeriod: 1h
exchanges: [{"eid":"Futures_Binance","currency":"BTC_USDT"}]
*/

//@version=2
////////////////////////////////////////////////////////////
//  Copyright by HPotter v1.0 25/08/2017
// Everyone wants a short-term, fast trading trend that works without large
// losses. That combination does not exist. But it is possible to have fast
// trading trends in which one must get in or out of the market quickly, but
// these have the distinct disadvantage of being whipsawed by market noise
// when the market is volatile in a sideways trending market. During these
// periods, the trader is jumping in and out of positions with no profit-making
// trend in sight. In an attempt to overcome the problem of noise and still be
// able to get closer to the actual change of the trend, Kaufman developed an
// indicator that adapts to market movement. This indicator, an adaptive moving
// average (AMA), moves very slowly when markets are moving sideways but moves
// swiftly when the markets also move swiftly, change directions or break out of
// a trading range.
//
// You can change long to short in the Input Settings
// Please, use it only for learning or paper trading. Do not for real trading.
////////////////////////////////////////////////////////////
strategy(title="Kaufman Moving Average Adaptive (KAMA)", shorttitle="Kaufman Moving Average Adaptive (KAMA)", overlay = true)
Length = input(21, minval=1)
xPrice = close
xvnoise = abs(xPrice - xPrice[1])
nfastend = 0.666
nslowend = 0.0645
reverse = input(false, title="Trade reverse")
nsignal = abs(xPrice - xPrice[Length])
nnoise = sum(xvnoise, Length)
nefratio = iff(nnoise != 0, nsignal / nnoise, 0)
nsmooth = pow(nefratio * (nfastend - nslowend) + nslowend, 2)
nAMA = nz(nAMA[1]) + nsmooth * (xPrice - nz(nAMA[1]))
pos = iff(close[1] > nAMA, 1,
	   iff(close[1] < nAMA, -1, nz(pos[1], 0)))
possig = iff(reverse and pos == 1, -1,
          iff(reverse and pos == -1, 1, pos))
if (possig == 1)
    strategy.entry("Long", strategy.long)
if (possig == -1)
    strategy.entry("Short", strategy.short)
barcolor(possig == -1 ? red: possig == 1 ? green : blue )
plot(nAMA, color=blue, title="KAMA")