Negociação quantitativa: estratégia orientada por volume
Visão geral
A estratégia de impulso de volume analisa as mudanças no volume de transações para determinar as variações de vazio no sentimento dos participantes do mercado. Divide o volume de transações em volumes de transações múltiplas e volumes de transações em branco e calcula a média móvel ponderada delas, gerando um sinal de vazio quando o volume de transações múltiplas é favorável e um sinal de vazio quando o volume de transações em branco é favorável.
Princípio da estratégia
A estratégia divide primeiro o volume de cada linha K em volume de transações de cabeça e volume de transações de cabeça vazia, de acordo com a relação entre o preço de fechamento e o preço de abertura. Se o preço de fechamento for maior do que o preço de abertura, o volume de transações de toda a linha K é o volume de transações de cabeça vazia; Se o preço de fechamento for menor do que o preço de abertura, o volume de transações de cabeça vazia é o restante da linha K, de acordo com a proporção ((máximo preço - preço de abertura) / ((máximo preço - preço mínimo)).
A média móvel ponderada do volume de transações de múltiplos cabeçalhos e do volume de transações de cabeçalhos para a última n-raiz K é então calculada. Se a média móvel do volume de transações de múltiplos cabeçalhos for maior do que a média móvel do volume de transações de cabeçalhos, e a diferença entre os dois for maior em relação ao volume de transações de múltiplos cabeçalhos do que o limiar predeterminado, então o sinal de múltiplos cabeçalhos será gerado. A regra de geração do sinal de cabeçalhos é semelhante.
O volume médio de transações também é configurado para identificar a área de liquidação. Se o volume de transações em excesso não tiver uma diferença visível, será sugerido que está em estado de liquidação.
Análise de vantagens
- Utilizando informações de volume de transação para avaliar o sentimento dos participantes do mercado, os sinais são produzidos com base teórica
- Identificação automática da área de equilíbrio para evitar a perda de sinais importantes
- Parâmetros personalizáveis para diferentes tipos de transações e períodos de tempo
- Pode-se distinguir entre sinais de cabeçalho e de cabeçalho vazio, ou apenas seguir um sinal de cabeçalho único.
Análise de Riscos
- Dados de volume de transações podem ser manipulados
- Os parâmetros padrão podem não ser adequados para todas as variedades e precisam ser otimizados
- Configuração incorrecta do parâmetro de identificação de compilação pode ter perdido o sinal
- Pode produzir sinais errados em períodos curtos
Pode-se reduzir o risco por meio de métodos como otimização de parâmetros e combinação de outros indicadores.
Direção de otimização
- Testar diferentes métodos para calcular o volume de transações
- Tente diferentes tipos de média móvel, como EMA, SMMA, etc.
- Parâmetros de ciclo para otimizar o cálculo da média
- Optimizar a identificação de parâmetros de diferença de volume de transação
- Combinação com outros indicadores técnicos para filtrar sinais
Resumir
A estratégia de condução de energia quantitativa pode ser usada isoladamente ou em combinação com outras estratégias por meio da inteligência de determinação da distribuição de volume de transação no espaço, para determinar automaticamente o sentimento do mercado e as mudanças de tendência. A otimização de parâmetros e a combinação de indicadores podem aumentar ainda mais a estabilidade e a lucratividade da estratégia.
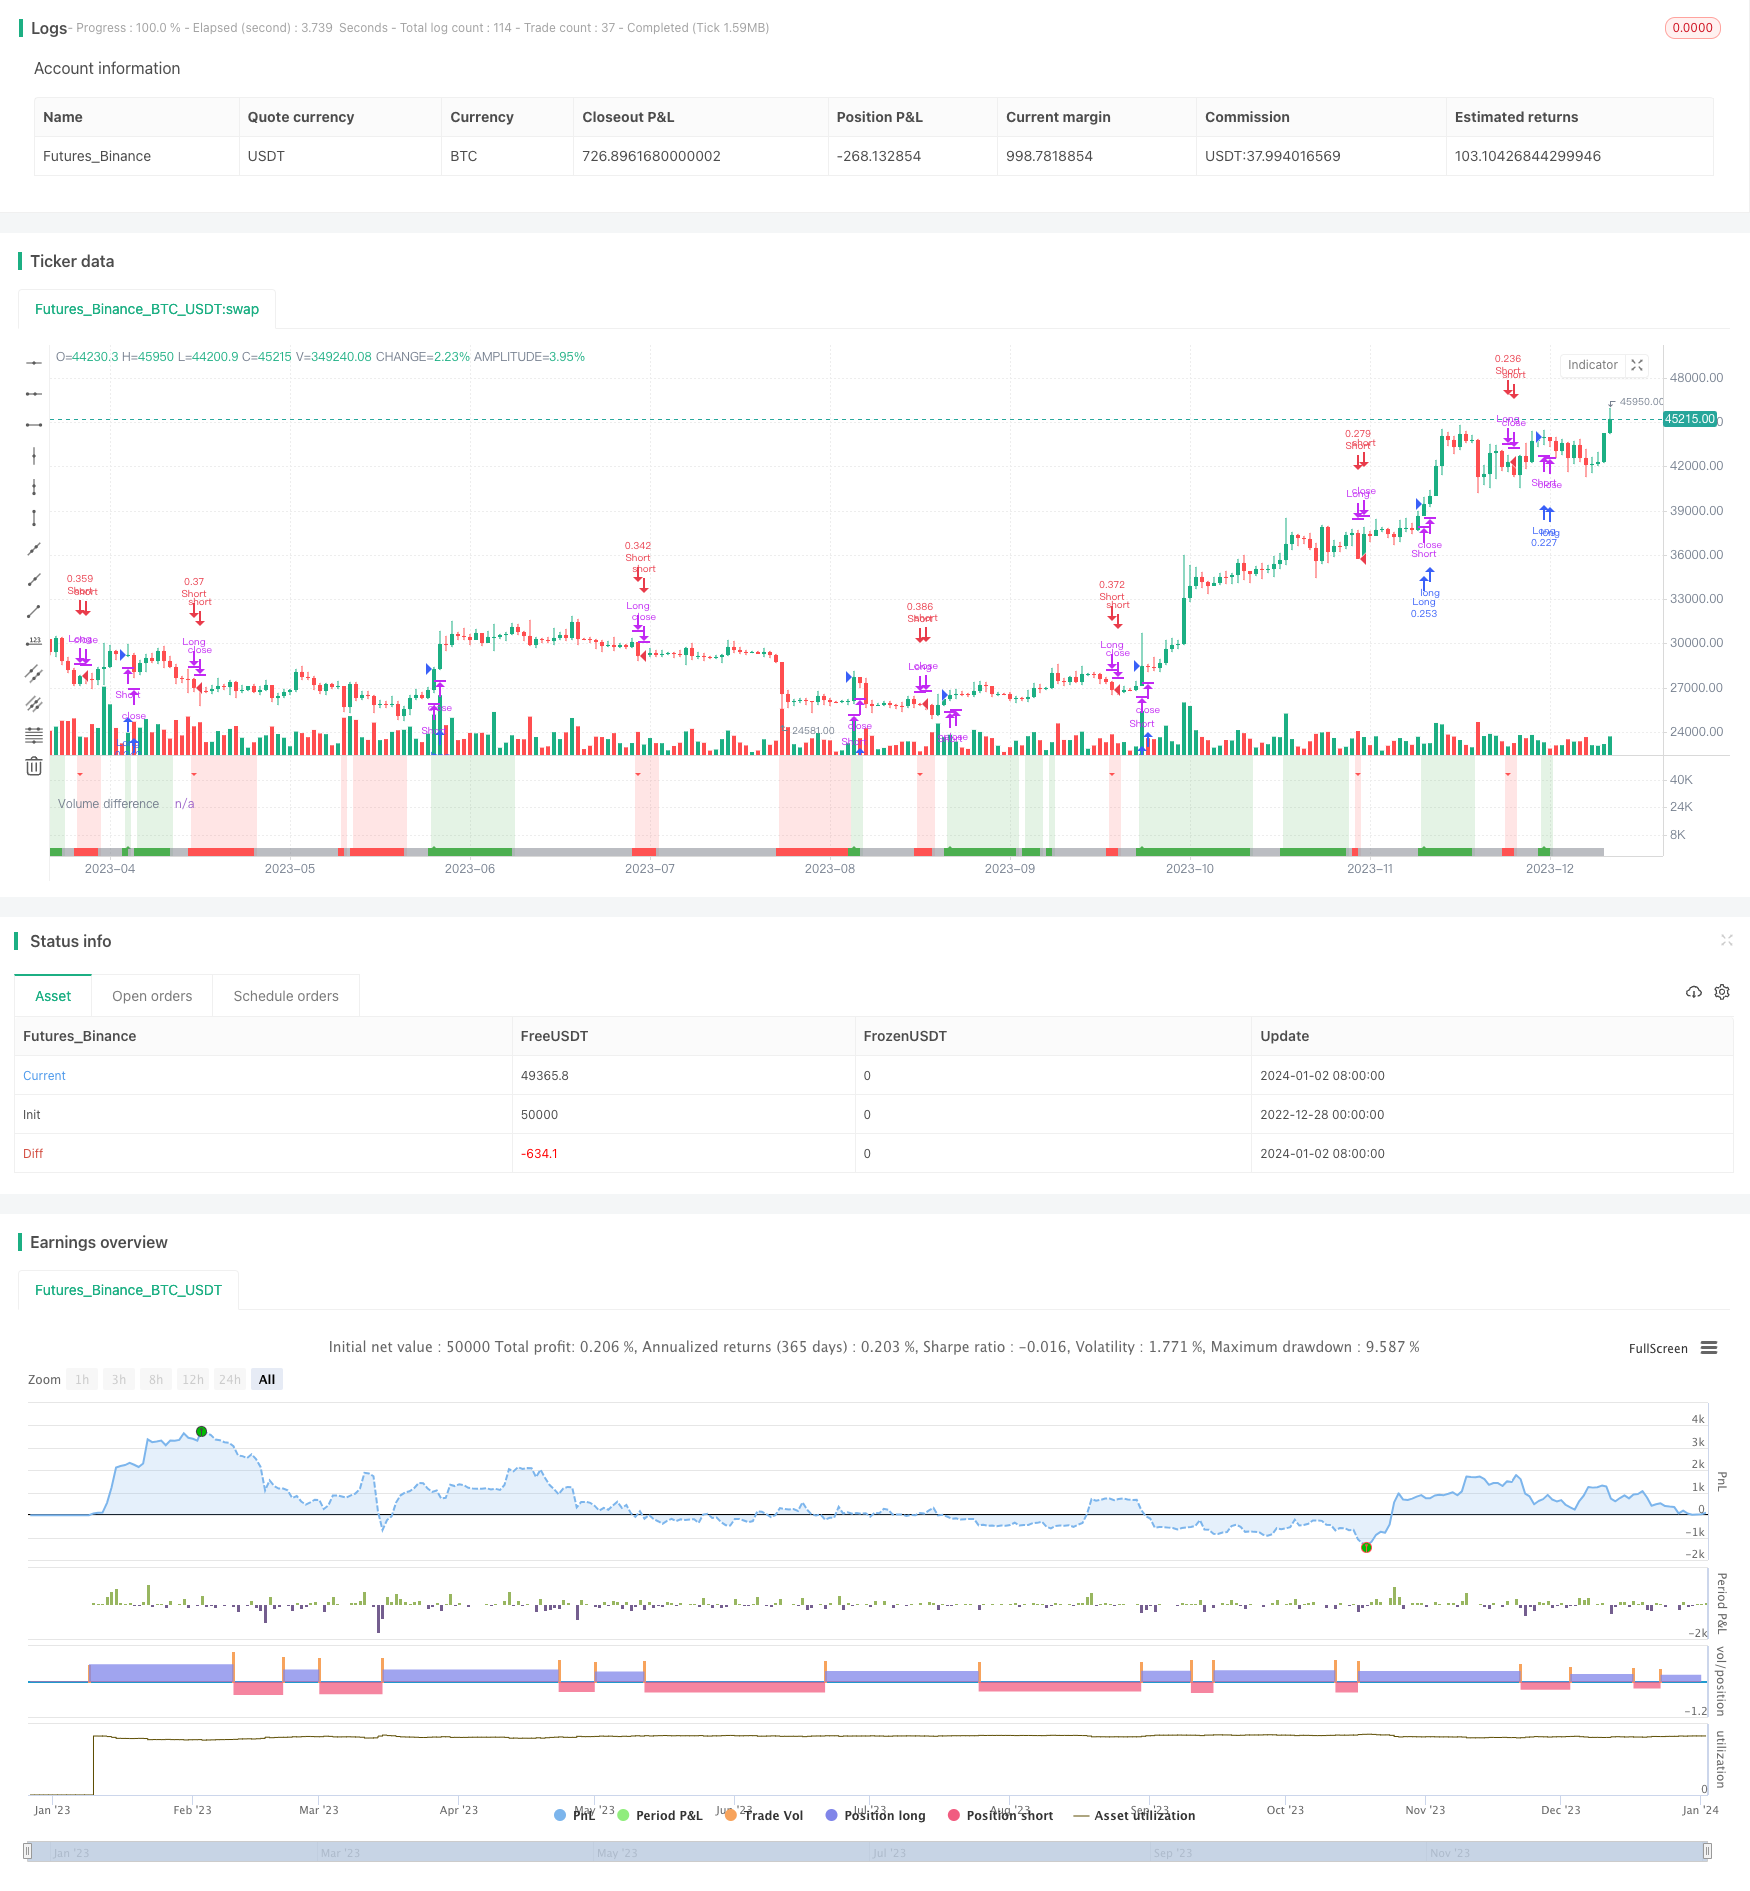
/*backtest
start: 2022-12-28 00:00:00
end: 2024-01-03 00:00:00
period: 1d
basePeriod: 1h
exchanges: [{"eid":"Futures_Binance","currency":"BTC_USDT"}]
*/

// This source code is subject to the terms of the Mozilla Public License 2.0 at https://mozilla.org/MPL/2.0/
// © Shuttle_Club
//@version=5

strategy('Volume fight strategy', default_qty_type=strategy.cash, default_qty_value=10000, currency='USD', commission_value=0.04, calc_on_order_fills=false, calc_on_every_tick=false, initial_capital=10000)

direction = input.string('ANY', 'Direction', options=['LONG', 'SHORT', 'ANY'], tooltip='Select the direction of trade.\n\nВыберите направление торговли.')
ma = input.int(11, 'Search_range', minval=1, tooltip='The range of estimation of the predominance of bullish or bearish volume (quantity bars). The smaller the TF, the higher the range value should be used to filter out false signals.\n\nДиапазон оценки преобладания бычьего или медвежьего объема (количество баров). Чем меньше ТФ, тем выше следует использовать значение диапазона, чтобы отфильтровать ложные сигналы.')
delta = input.float(15, 'Smoothing_for_flat,%', step=0.5, minval=0, tooltip='Smoothing to reduce false signals and highlight the flat zone. If you set the percentage to zero, the flat zones will not be highlighted, but there will be much more false signals, since the indicator becomes very sensitive when the smoothing percentage decreases.\n\nСглаживание для уменьшения ложных сигналов и выделения зоны флета. Если выставить процент равным нулю, то зоны флета выделяться не будут, но будет гораздо больше ложных сигналов, так как индикатор становится очень чувствительным при снижении процента сглаживания')
bgshow = input.bool(true, 'Show background zones', tooltip='Show the color background of the current trading zone.\n\nПоказывать цветовой фон текущей торговой зоны.')
all_signal_show = input.bool(false, 'Show each setup in zone', tooltip='Show every signals into trading zone.\n\nПоказывать каждый сигнал внутри торговой зоны.')

/////   CALCULATION
bull_vol = open < close ? volume : volume * (high - open) / (high - low)  //determine the share of bullish volume
bear_vol = open > close ? volume : volume * (open - low) / (high - low)  //determine the share of bearish volume
avg_bull_vol = ta.vwma(bull_vol, ma)  //determine vwma
avg_bear_vol = ta.vwma(bear_vol, ma)
diff_vol = ta.sma(avg_bull_vol / volume - 1 - (avg_bear_vol / volume - 1), ma)  //normalize and smooth the values
vol_flat = math.abs(avg_bull_vol + avg_bear_vol) / 2  //determine average value for calculation flat-filter

/////   SIGNALS
up = int(na), up := nz(up[1])
dn = int(na), dn := nz(dn[1])
bull = avg_bull_vol > avg_bear_vol and vol_flat / avg_bull_vol < 1 - delta / 100  //determine up zones
bear = avg_bull_vol < avg_bear_vol and vol_flat / avg_bear_vol < 1 - delta / 100  //determine dn zones

if bull
    up += 1, dn := 0
    dn
if bear
    dn += 1, up := 0
    up
if not bull and not bear and all_signal_show
    up := 0, dn := 0
    dn

/////   PLOTTING
plotshape(bull and up == 1, 'UP', location=location.bottom, style=shape.triangleup, color=color.new(color.green, 0), size=size.tiny)
plotshape(bear and dn == 1, 'DN', location=location.top, style=shape.triangledown, color=color.new(color.red, 0), size=size.tiny)
bgcolor(title='Trading zones', color=bgshow and avg_bull_vol > avg_bear_vol and vol_flat / avg_bull_vol < 1 - delta / 100 ? color.new(color.green, 85) : bgshow and avg_bull_vol < avg_bear_vol and vol_flat / avg_bear_vol < 1 - delta / 100 ? color.new(color.red, 85) : na)
plot(diff_vol, 'Volume difference', style=plot.style_area, color=avg_bull_vol > avg_bear_vol and vol_flat / avg_bull_vol < 1 - delta / 100 ? color.new(color.green, 0) : avg_bull_vol < avg_bear_vol and vol_flat / avg_bear_vol < 1 - delta / 100 ? color.new(color.red, 0) : color.new(color.gray, 50))

strategy.close('Short', comment='close', when=bull and up == 1)
strategy.close('Long', comment='close', when=bear and dn == 1)
strategy.entry('Long', strategy.long, when=direction != 'SHORT' and bull and up == 1)
strategy.entry('Short', strategy.short, when=direction != 'LONG' and bear and dn == 1)

if bull and up==1
    alert('Bullish movement! LONG trading zone', alert.freq_once_per_bar_close)
if bear and dn==1
    alert('Bearish movement! SHORT trading zone', alert.freq_once_per_bar_close)