Estratégia dinâmica de trailing stop loss
Visão geral
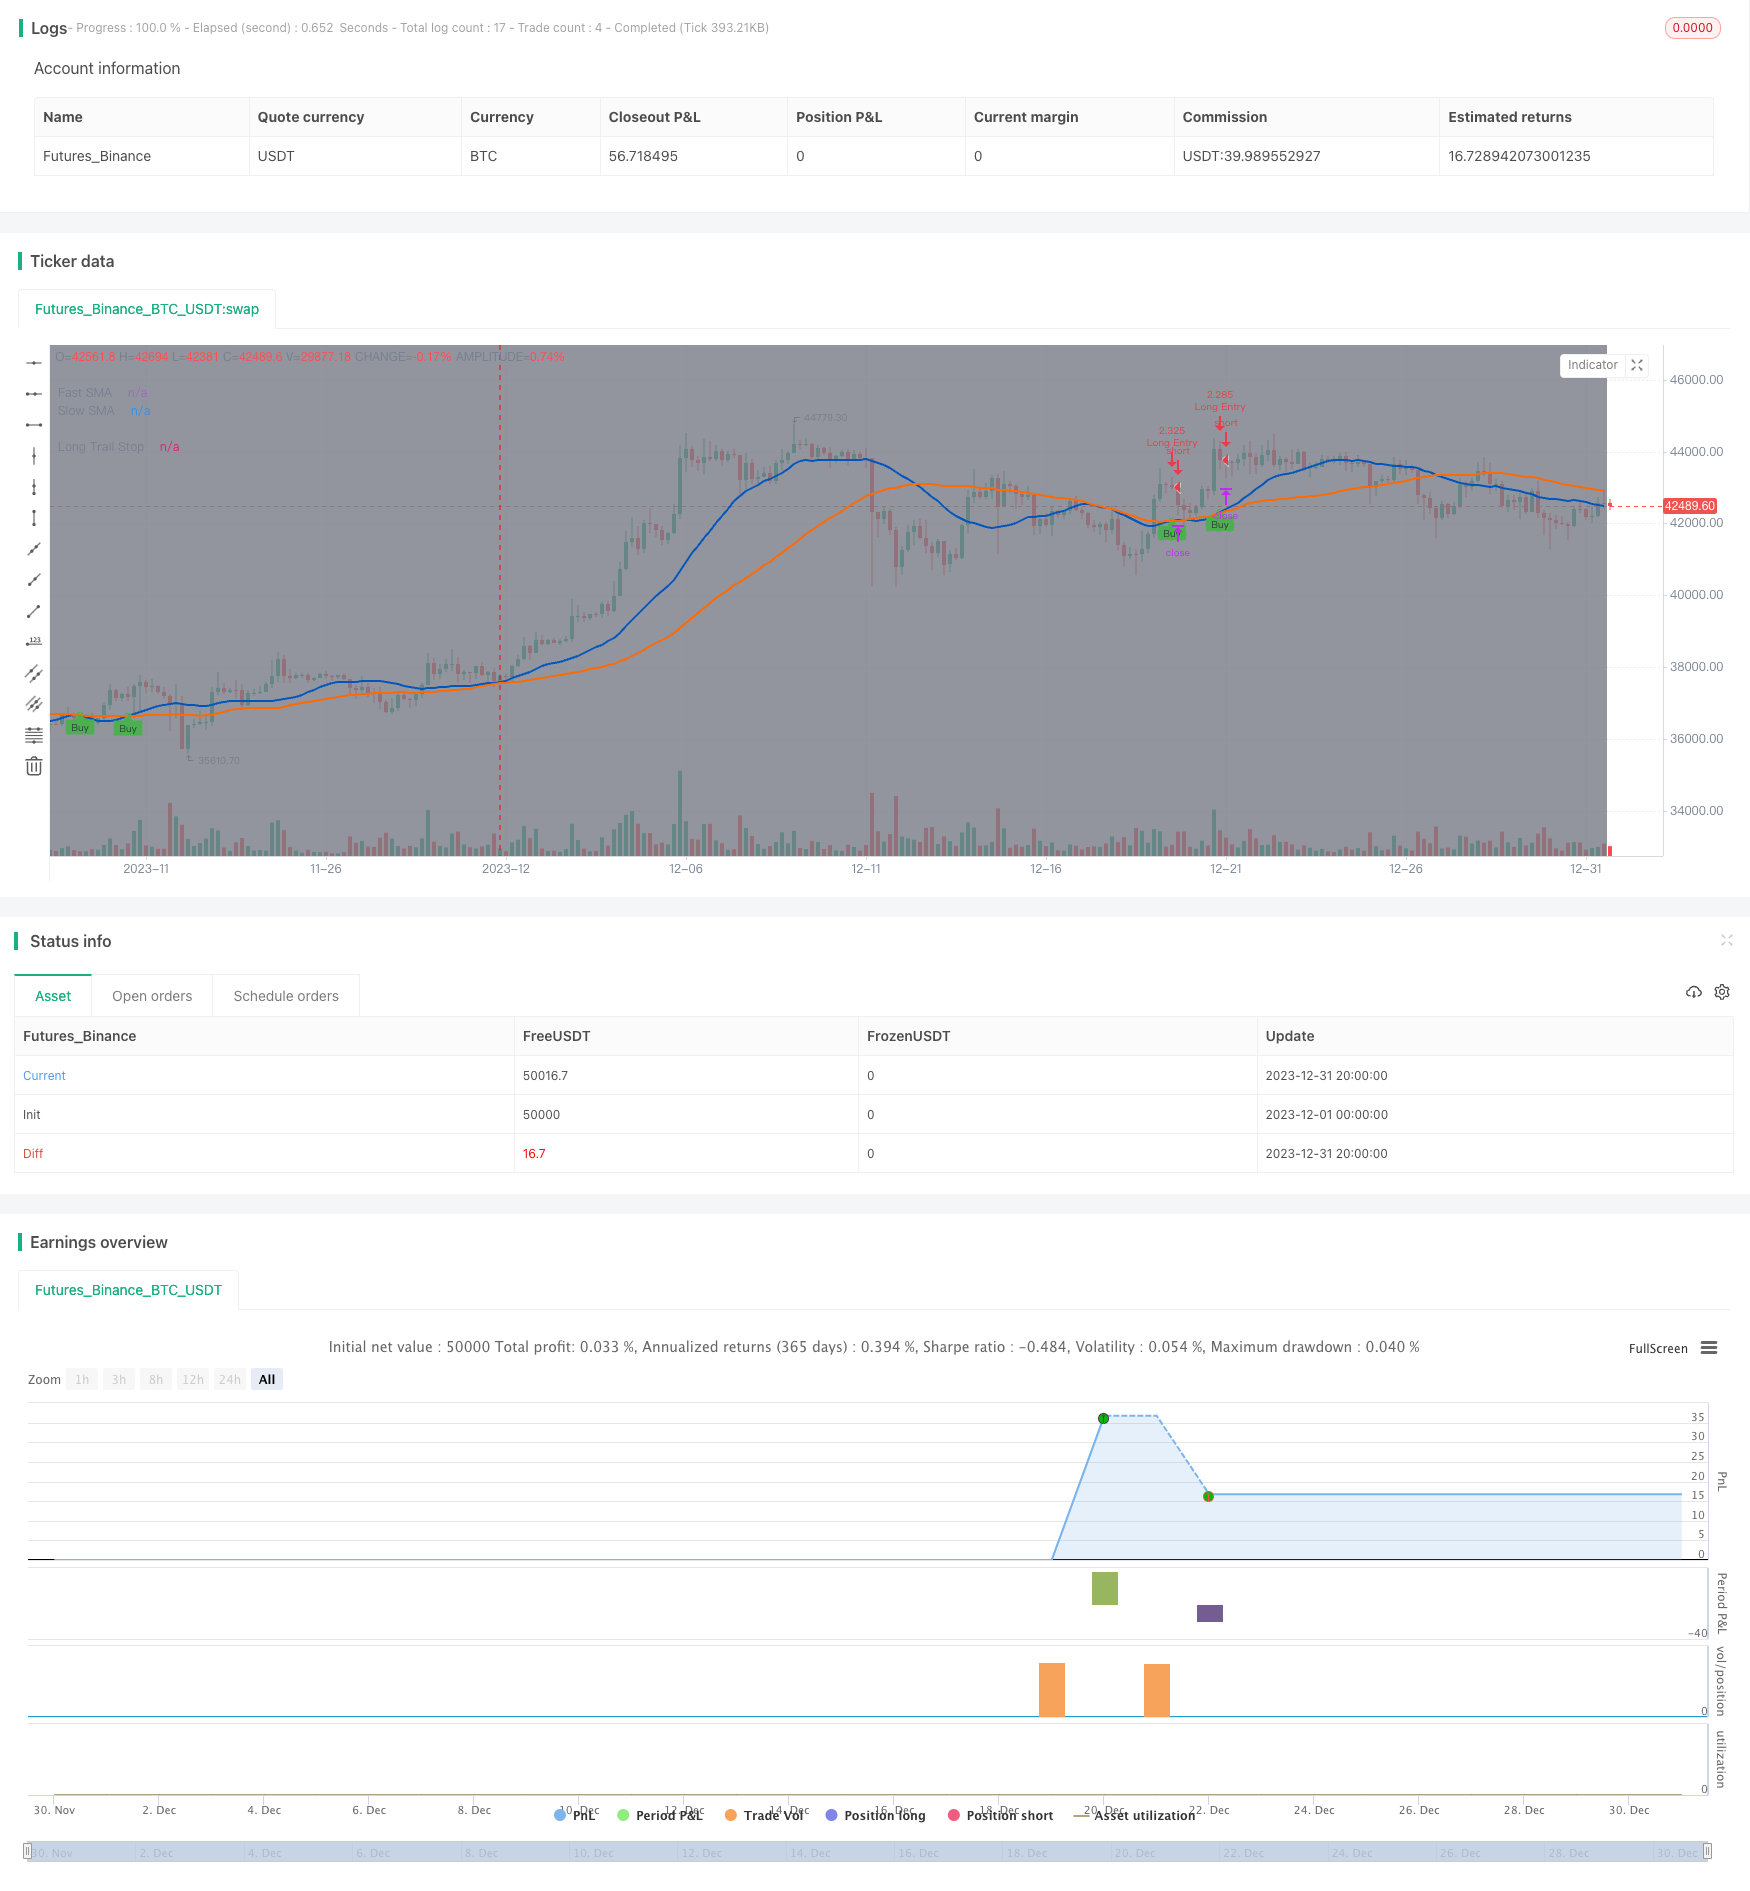
Esta estratégia julga a tendência calculando um cruzamento entre a média móvel rápida e a média móvel lenta, fazendo um salto na média móvel lenta em cima da média móvel rápida e configurando uma linha de stop loss de rastreamento dinâmico para bloquear o lucro, com o stop loss saindo quando a proporção de mudança de preço é determinada.
Princípio da estratégia
A estratégia usa uma média móvel rápida e uma forquilha de média móvel lenta para determinar o início de uma tendência múltipla. Concretamente, é a média móvel simples calculada para o preço de fechamento em um determinado período, comparando o valor da média rápida e da média lenta. Quando a média móvel rápida atravessa a média móvel lenta, é julgado o início de uma tendência múltipla, e é então que se abre uma posição.
A estratégia não estabelece um stop loss fixo, mas usa uma linha de stop loss de rastreamento dinâmico para bloquear o lucro após a abertura da posição. A configuração da linha de stop loss é a seguinte:*(1- Percentual de Stop Set) │ Isso permite que a linha de Stop aumente com o aumento do preço e, em uma determinada proporção, a parada de Stop é retirada.
A vantagem deste método é que o lucro pode ser retomado indefinidamente e pode ser bloqueado com um stop loss após o lucro atingir um determinado nível.
Análise de vantagens
Os principais benefícios desta estratégia de stop loss são:
Pode ser jogado indefinidamente e não perder grandes jogadas. O uso de stop loss fixo é fácil de ser interrompido após o início de grandes jogadas.
Pode-se bloquear o lucro através da definição de uma percentagem de stop loss. Se apenas a busca não parar o prejuízo, o negócio inteiro pode perder no final. A definição de stop loss pode bloquear o lucro.
É mais flexível do que o stop-loss fixo. O stop-loss fixo só pode ser definido em um preço, e o stop-loss aqui varia de acordo com o preço máximo.
O risco de retração é menor. Quando se usa um stop-loss fixo, o preço de stop-loss é maior do que o preço máximo e pode ser interrompido em uma retracção normal.
Análise de Riscos
A estratégia também apresenta alguns riscos:
Os indicadores de sinal de entrada são instáveis e podem gerar sinais errados.
A única forma de parar o prejuízo, sem considerar outros fatores. O mercado pode sofrer mudanças significativas que podem fazer com que a estratégia falhe.
Não há restrição de parada, dependendo da parada de perdas. Se a parada de perdas falhar, pode causar grandes perdas.
A configuração dos dados precisa ser otimizada. Parâmetros como o período da média móvel precisam ser ajustados para o melhor.
Direção de otimização
A estratégia também pode ser melhorada nos seguintes aspectos:
Adicionar mais indicadores para confirmar a admissão e evitar sinais errados.
Aumentar a configuração de suspensão. Suspensão quando a receita atinge uma certa proporção.
Aumentar a segurança do stop loss. Ajustar drasticamente a distância de stop loss quando ocorrem anomalias no mercado.
Adaptação para otimização de variedades de negociação, períodos de negociação, etc. Os parâmetros de diferentes variedades e períodos de negociação precisam ser ajustados.
Adicionar aprendizado de máquina para ajustar dinamicamente os parâmetros. Permitir que o modelo otimize automaticamente os indicadores de julgamento e a amplitude de parada.
Resumir
O conceito geral desta estratégia é claro e razoável. O uso de tendências de avaliação de linha média rápida e lenta é um método mais clássico, e o método de parada de rastreamento dinâmico de perdas pode efetivamente bloquear os lucros e reduzir o risco. Mas esses indicadores e parâmetros precisam ser constantemente testados e otimizados para tornar a estratégia estável e lucrativa.
/*backtest
start: 2023-12-01 00:00:00
end: 2023-12-31 23:59:59
period: 4h
basePeriod: 15m
exchanges: [{"eid":"Futures_Binance","currency":"BTC_USDT"}]
*/

//@version=4
//
// ▒▒▒▒▒▒▒▒▒▒▒▒▒▒▒▒▒▒▒▒▒▒▒▒▒▒▒▒▒▒▒▒▒▒▒▒▒▒▒▒▒▒▒▒▒▒▒▒▒▒▒▒▒▒▒▒▒▒▒▒▒▒▒▒▒▒▒▒▒▒▒▒▒▒▒▒▒▒▒▒▒▒▒▒▒▒▒▒▒▒▒▒▒▒▒▒▒▒▒▒▒▒▒▒▒▒▒▒▒▒▒▒▒▒
//  -----------------------------------------------------------------------------
//  Copyright 2021 Iason Nikolas | jason5480
//  Trainiling Take Profit Trailing Stop Loss script may be freely distributed under the MIT license.
//
//  Permission is hereby granted, free of charge,
//  to any person obtaining a copy of this software and associated documentation files (the "Software"),
//  to deal in the Software without restriction, including without limitation the rights to use, copy, modify, merge,
//  publish, distribute, sublicense, and/or sell copies of the Software, and to permit persons to whom the Software is furnished to do so,
//  subject to the following conditions:
//
//  The above copyright notice and this permission notice shall be included in all copies or substantial portions of the Software.
//
//  THE SOFTWARE IS PROVIDED "AS IS", WITHOUT WARRANTY OF ANY KIND,
//  EXPRESS OR IMPLIED, INCLUDING BUT NOT LIMITED TO THE WARRANTIES OF MERCHANTABILITY,
//  FITNESS FOR A PARTICULAR PURPOSE AND NONINFRINGEMENT. IN NO EVENT SHALL THE AUTHORS OR COPYRIGHT HOLDERS BE LIABLE FOR ANY CLAIM,
//  DAMAGES OR OTHER LIABILITY, WHETHER IN AN ACTION OF CONTRACT, TORT OR OTHERWISE, ARISING FROM,
//  OUT OF OR IN CONNECTION WITH THE SOFTWARE OR THE USE OR OTHER DEALINGS IN THE SOFTWARE.
//
//  -----------------------------------------------------------------------------
//
//  Authors:  @jason5480
//  Revision: v1.0.0
//  Date:     05-May-2021
//
//  Description
//  =============================================================================
//  This strategy will go long if fast MA crosses over slow MA.
//  The strategy will exit from long position when the price increases by a fixed percentage.
//  If the trailing take profit is checked then the strategy instead of setting a limit order in a predefined price (based on the percentage)
//  it will follow the price with small steps (percentagewise)
//  If the price drops by this percentage then the exit order will be executed
//
//  The strategy has the following parameters:
//
//  Fast SMA Length - How many candles back to calculte the fast SMA.
//  Slow SMA Length - How many candles back to calculte the slow SMA.
//  Enable Trailing - Enable or disable the trailing.
//  Stop Loss % - The percentage of the price decrease to set the stop loss price target for long positions.
//
//  -----------------------------------------------------------------------------
//  Disclaimer:
//    1. I am not licensed financial advisors or broker dealer. I do not tell you
//       when or what to buy or sell. I developed this software which enables you
//       execute manual or automated trades using TradingView. The
//       software allows you to set the criteria you want for entering and exiting
//       trades.
//    2. Do not trade with money you cannot afford to lose.
//    3. I do not guarantee consistent profits or that anyone can make money with no
//       effort. And I am not selling the holy grail.
//    4. Every system can have winning and losing streaks.
//    5. Money management plays a large role in the results of your trading. For
//       example: lot size, account size, broker leverage, and broker margin call
//       rules all have an effect on results. Also, your Take Profit and Stop Loss
//       settings for individual pair trades and for overall account equity have a
//       major impact on results. If you are new to trading and do not understand
//       these items, then I recommend you seek education materials to further your
//       knowledge.
//
//    YOU NEED TO FIND AND USE THE TRADING SYSTEM THAT WORKS BEST FOR YOU AND YOUR
//    TRADING TOLERANCE.
//
//    I HAVE PROVIDED NOTHING MORE THAN A TOOL WITH OPTIONS FOR YOU TO TRADE WITH THIS PROGRAM ON TRADINGVIEW.
//
//    I accept suggestions to improve the script.
//    If you encounter any problems I will be happy to share with me.
//  -----------------------------------------------------------------------------
//
// ▒▒▒▒▒▒▒▒▒▒▒▒▒▒▒▒▒▒▒▒▒▒▒▒▒▒▒▒▒▒▒▒▒▒▒▒▒▒▒▒▒▒▒▒▒▒▒▒▒▒▒▒▒▒▒▒▒▒▒▒▒▒▒▒▒▒▒▒▒▒▒▒▒▒▒▒▒▒▒▒▒▒▒▒▒▒▒▒▒▒▒▒▒▒▒▒▒▒▒▒▒▒▒▒▒▒▒▒▒▒▒▒▒▒
// SETUP ============================================================================================================
strategy(title = "Trailing Stop Loss",
         shorttitle = "TSL",
         overlay = true,
         pyramiding = 0,
         calc_on_every_tick = true,
         default_qty_type = strategy.cash,
         default_qty_value = 100000,
         initial_capital = 100000)

//
// ▒▒▒▒▒▒▒▒▒▒▒▒▒▒▒▒▒▒▒▒▒▒▒▒▒▒▒▒▒▒▒▒▒▒▒▒▒▒▒▒▒▒▒▒▒▒▒▒▒▒▒▒▒▒▒▒▒▒▒▒▒▒▒▒▒▒▒▒▒▒▒▒▒▒▒▒▒▒▒▒▒▒▒▒▒▒▒▒▒▒▒▒▒▒▒▒▒▒▒▒▒▒▒▒▒▒▒▒▒▒▒▒▒▒
// INPUTS ===========================================================================================================

// STRATEGY INPUT ===================================================================================================
fastMALen = input(defval = 21, title = "Fast SMA Length", type = input.integer, group = "Strategy", tooltip = "How many candles back to calculte the fast SMA.")
slowMALen = input(defval = 49, title = "Slow SMA Length", type = input.integer, group = "Strategy", tooltip = "How many candles back to calculte the slow SMA.")

enableStopLossTrailing = input(defval = true, title = "Enable Trailing", type = input.bool, group = "Strategy", tooltip = "Enable or disable the trailing for stop loss.")
longTrailingStopLossPerc = input(defval = 7.5, title = 'Long Stop Loss %', type = input.float, minval = 0.1, maxval = 100, step = 0.1, inline = "Trailing Stop Loss Perc", group = "Strategy") / 100

// BACKTEST PERIOD INPUT ============================================================================================
fromDate = input(defval = timestamp("01 Jan 2021 00:00 UTC"), title = "From Date", type = input.time, minval = timestamp("01 Jan 1970 00:00 UTC"), group = "Backtest Period") // backtest start date
toDate   = input(defval = timestamp("31 Dec 2121 23:59 UTC"), title = "To Date",   type = input.time, minval = timestamp("01 Jan 1970 00:00 UTC"), group = "Backtest Period") // backtest finish date

isWithinBacktestPeriod() => true

// SHOW PLOT INPUT ==================================================================================================
showDate = input(defval = true, title = "Show Backtest Range", type = input.bool, group = "Plot", tooltip = "Gray out the backround of the backtest period.")

//
// ▒▒▒▒▒▒▒▒▒▒▒▒▒▒▒▒▒▒▒▒▒▒▒▒▒▒▒▒▒▒▒▒▒▒▒▒▒▒▒▒▒▒▒▒▒▒▒▒▒▒▒▒▒▒▒▒▒▒▒▒▒▒▒▒▒▒▒▒▒▒▒▒▒▒▒▒▒▒▒▒▒▒▒▒▒▒▒▒▒▒▒▒▒▒▒▒▒▒▒▒▒▒▒▒▒▒▒▒▒▒▒▒▒▒
// STRATEGY LOGIC ===================================================================================================

fastMA = sma(close, fastMALen)
slowMA = sma(close, slowMALen)

bool startLongDeal = crossover(fastMA, slowMA)

bool longIsActive = startLongDeal or strategy.position_size > 0

// determine trailing stop loss price
float longTrailingStopLossPrice = na
longTrailingStopLossPrice := if (longIsActive)
    stopValue = high * (1 - longTrailingStopLossPerc)
    max(stopValue, nz(longTrailingStopLossPrice[1]))
else
    na

//
// ▒▒▒▒▒▒▒▒▒▒▒▒▒▒▒▒▒▒▒▒▒▒▒▒▒▒▒▒▒▒▒▒▒▒▒▒▒▒▒▒▒▒▒▒▒▒▒▒▒▒▒▒▒▒▒▒▒▒▒▒▒▒▒▒▒▒▒▒▒▒▒▒▒▒▒▒▒▒▒▒▒▒▒▒▒▒▒▒▒▒▒▒▒▒▒▒▒▒▒▒▒▒▒▒▒▒▒▒▒▒▒▒▒▒
// STRATEGY EXECUTION ===============================================================================================

if (isWithinBacktestPeriod())
    // getting into LONG position
    strategy.entry(id = "Long Entry", long = strategy.long, when = startLongDeal, alert_message = "Long(" + syminfo.ticker + "): Started")
    // submit exit orders for trailing stop loss price
    strategy.exit(id = "Long Stop Loss", from_entry = "Long Entry", stop = longTrailingStopLossPrice, when = longIsActive, alert_message = "Long(" + syminfo.ticker + "): Stop Loss activated")


//
// ▒▒▒▒▒▒▒▒▒▒▒▒▒▒▒▒▒▒▒▒▒▒▒▒▒▒▒▒▒▒▒▒▒▒▒▒▒▒▒▒▒▒▒▒▒▒▒▒▒▒▒▒▒▒▒▒▒▒▒▒▒▒▒▒▒▒▒▒▒▒▒▒▒▒▒▒▒▒▒▒▒▒▒▒▒▒▒▒▒▒▒▒▒▒▒▒▒▒▒▒▒▒▒▒▒▒▒▒▒▒▒▒▒▒
// PLOT DATE POSITION MA AND TRAILING TAKE PROFIT STOP LOSS =========================================================

bgcolor(color = showDate and isWithinBacktestPeriod() ? color.gray : na, transp = 90)

plot(series = fastMA, title = "Fast SMA", color = #0056BD, linewidth = 2, style = plot.style_line)
plot(series = slowMA, title = "Slow SMA", color = #FF6A00, linewidth = 2, style = plot.style_line)
plotshape(series = isWithinBacktestPeriod() and startLongDeal and strategy.position_size <= 0 ? fastMA : na, title = "UpTrend Begins", style = shape.circle, location = location.absolute, color = color.green, transp = 0, size = size.tiny)
plotshape(series = isWithinBacktestPeriod() and startLongDeal and strategy.position_size <= 0 ? fastMA : na, title = "Buy", text = "Buy", style = shape.labelup, location = location.absolute, color = color.green, textcolor = color.black, transp = 0, size = size.tiny)

plot(series = strategy.position_avg_price, title = "Position", color = color.blue, linewidth = 2, style = plot.style_linebr, offset = 1)
plot(series = longTrailingStopLossPrice, title = "Long Trail Stop", color = color.fuchsia, linewidth = 2, style = plot.style_linebr, offset = 1)

// ==================================================================================================================