Estratégia de reversão de tendência de curto prazo
Visão geral
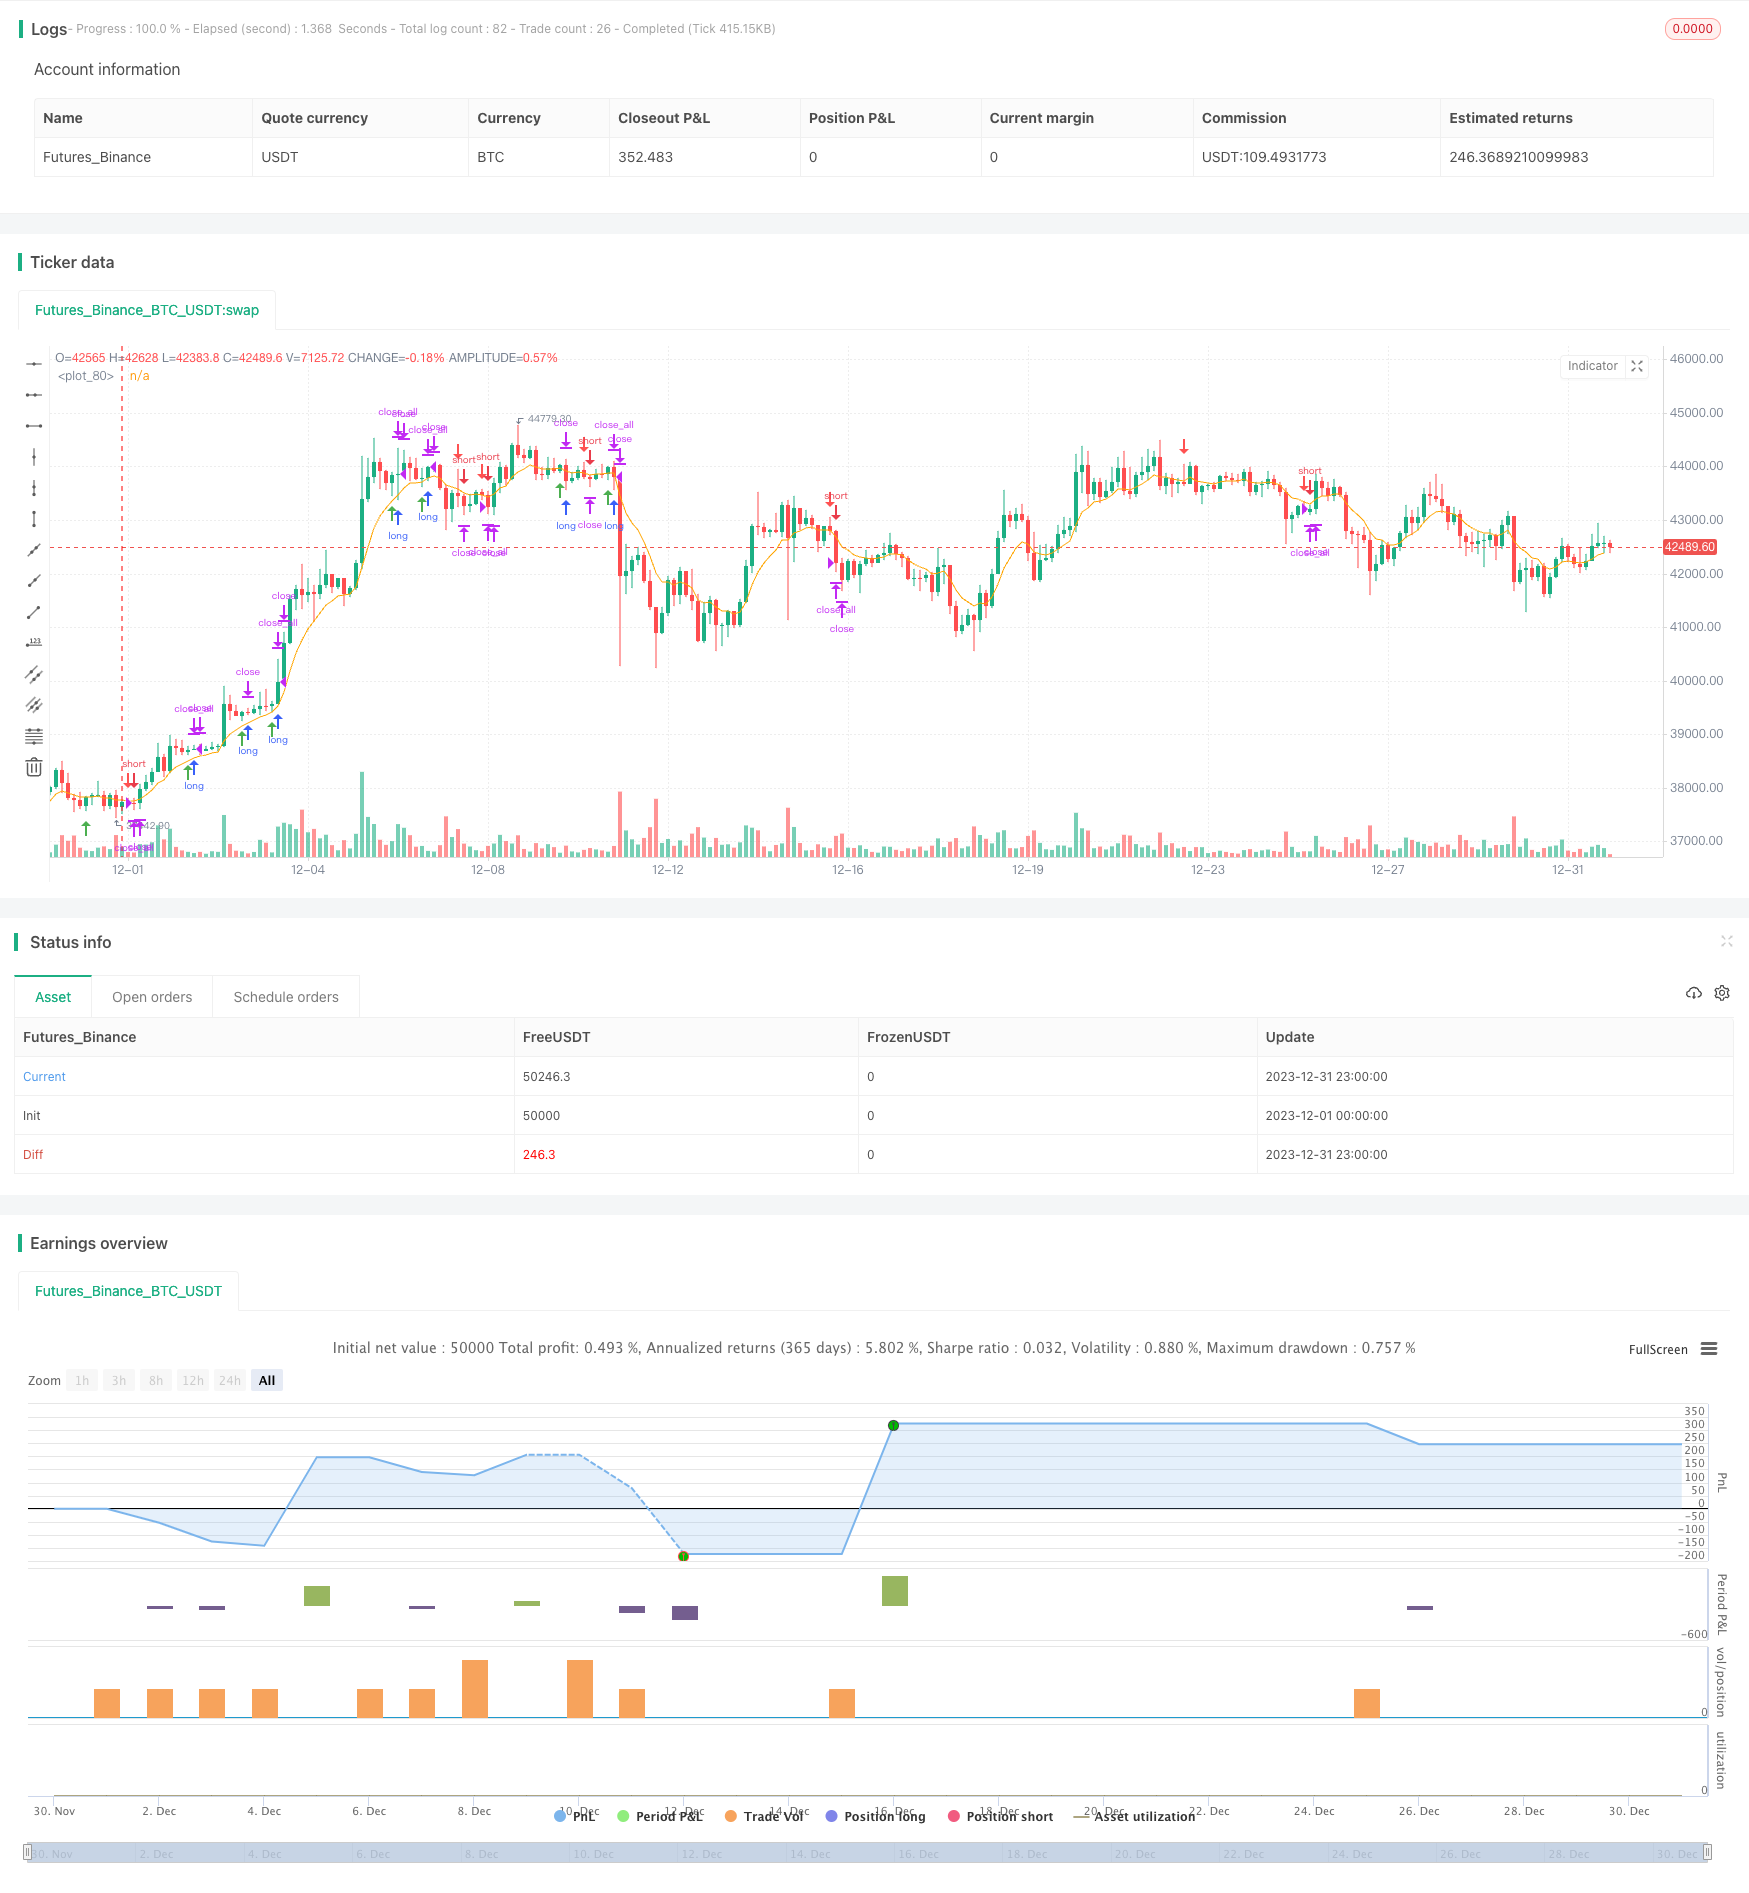
A estratégia de reversão de rastreamento de tendências é uma estratégia de negociação de tendências de curto prazo baseada em futuros de NQ de 15 minutos. Ela procura oportunidades de negociação através da identificação de ondas de tendência e formas de reversão.
Princípio da estratégia
A estratégia baseia-se principalmente nos seguintes princípios:
Usando o EMA de 8 ciclos como o principal indicador de filtragem de tendências, o EMA acima é positivo, o EMA abaixo é negativo.
A identificação de determinadas formas de inversão de linha K como sinais de entrada, incluindo um sinal de leitura de linha curta após linha longa e um sinal de leitura de linha curta após linha longa, indicam que a tendência pode começar a se inverter.
O ponto de entrada é definido como o ponto mais alto ou mais baixo próximo da linha K invertida, e o ponto de parada é definido como o ponto mais alto ou mais baixo da própria linha K invertida, para obter uma eficiente taxa de retorno do risco.
A eficácia do sinal de inversão é julgada usando o relacionamento de entidades de linha K, como o preço de abertura de uma linha negativa é maior do que a entidade de linha K anterior, a qual contém completamente regras para filtrar o ruído.
A estratégia de operar apenas em determinados períodos de negociação, evitando períodos especiais, como o mês de troca do contrato principal do mercado, para evitar perdas desnecessárias causadas por situações anormais.
Análise de vantagens
A estratégia tem as seguintes vantagens principais:
Os sinais de estratégia são simples, eficazes e fáceis de aprender e implementar.
O mercado de ações é um mercado de ações que se baseia em tendências e reversões para evitar a dupla morte de um mercado de ações e um mercado de ações.
Controle de risco, configuração de stop loss razoável, favorável à gestão de fundos.
A demanda de dados é pequena e é adequada para todos os tipos de softwares e plataformas.
A frequência de negociação é alta e é ideal para investidores interessados em negociações ativas de curta duração.
Riscos e soluções
A estratégia também apresenta alguns riscos, principalmente:
As chances de reversão são insuficientes, os sinais são menores. As regras de julgamento de reversão podem ser adequadamente relaxadas.
Quando ocorrem falsos problemas de penetração, mais indicadores de filtragem podem ser adicionados para um julgamento conjunto.
Há instabilidade no disco noturno e no horário fora do mainstream. Pode ser configurado para operar apenas no horário de negociação dos EUA.
O espaço para a otimização de parâmetros é limitado. Pode-se tentar técnicas como o aprendizado de máquina para encontrar parâmetros melhores.
Direção de otimização
A estratégia ainda tem espaço para otimização, e as principais direções incluem:
Testar parâmetros de EMA de períodos mais longos para melhorar o julgamento de tendências.
Aumentar o índice de mercado de ações como um indicador adicional de filtragem de tendências.
Otimizar automaticamente os pontos de entrada e de parada usando tecnologias como a aprendizagem de máquina.
Aumentar a posição baseada na volatilidade e o mecanismo de ajuste dinâmico de stop loss.
Tentar arbitragem multi-variedade para dispersar ainda mais o risco sistemático de uma única variedade.
Resumir
A estratégia de inversão de tendência é, em geral, uma estratégia de linha curta muito prática, com poucos parâmetros simples, fácil de usar, com bom controle de risco pessoal, adequada para comerciantes de linha curta ativos. A estratégia tem um certo espaço de otimização, investir um certo esforço de pesquisa e desenvolvimento pode torná-la programada para operação, mesmo para fundos de linha média e longa, com bom potencial de desenvolvimento.
/*backtest
start: 2023-12-01 00:00:00
end: 2023-12-31 23:59:59
period: 3h
basePeriod: 15m
exchanges: [{"eid":"Futures_Binance","currency":"BTC_USDT"}]
*/

// This Pine Script™ code is subject to the terms of the Mozilla Public License 2.0 at https://mozilla.org/MPL/2.0/
// © bdrex95

//@version=5

// Rob Reversal Strategy - Official
// Using Rob Reversal Indicator: Original
// Description
// This indicator is based on the strategy created by Trader Rob on the NQ 15m chart.
//
// Timeframe for trading is 8:30am-1:15pm Central.
//
// Above the EMA line, look for a long position. You will have a short candle, then a long candle that opens below the short candle. It will have a lower high and a lower low. Once the long candle closes, your entry will be 1 tick above the wick (green line) and stop loss will be at the bottom of the bottom wick (red line).
//
// Below the EMA line, look for a short position. You will have a long candle, then a short candle that opens above the long candle. It will have a higher high and a higher low. Once the short candle closes, your entry will be 1 tick below the wick (green line) and stop loss will be at the top of the top wick (red line).
//

strategy("Trader Rob Reversal Strategy NQ 15min", shorttitle="Official Rob Rev Strat", overlay=true)


//--- Session Input ---
sess = input(defval = "0930-1415", title="Trading Session")
t = time(timeframe.period, sess)
sessionOpen = na(t) ? false : true

flat_time = input(defval = "1515-1558", title="Close All Open Trades")
ft = time(timeframe.period, flat_time)
flatOpen = na(ft) ? false : true


// Calculate start/end date and time condition
startDate = input(timestamp('2018-12-24T00:00:00'),group = "ALL STRATEGY SETTINGS BELOW")
finishDate = input(timestamp('2029-02-26T00:00:00'),group = "ALL STRATEGY SETTINGS BELOW")
time_cond = true


emaColor = input.color(color.orange, title="EMA Color")
emaLength = input.int(8, title="EMA Length")


emaInd = ta.ema(close, emaLength)


rr = input(1.0,"Enter RR",group = "TP/SL CONDITION INPUTS HERE")


sellShapeInput = input.string("Arrow", title="Sell Entry Shape", options=["Arrow", "Triangle"])
buyShapeInput = input.string("Arrow", title="Buy Entry Shape", options=["Arrow", "Triangle"])


sellShapeOption = switch sellShapeInput
    "Arrow" => shape.arrowdown
    "Triangle" => shape.triangledown

buyShapeOption = switch buyShapeInput
    "Arrow" => shape.arrowup
    "Triangle" => shape.triangleup


O = open
C = close
H = high
L = low


sellEntry = (C[1] > O[1]) and (C < O) and (H[1] < H) and (C < H[1]) and (C > L[1]) and (L > L[1]) and (C < emaInd) and sessionOpen and time_cond
buyEntry = (C[1] < O[1]) and (C > O) and (H[1] > H) and (L[1] > L) and (C < H[1]) and (C > L[1]) and (C > emaInd) and sessionOpen and time_cond


sellEntry_index = ta.valuewhen(sellEntry,bar_index,0)
sellEntry_hi = ta.valuewhen(sellEntry,high,0)
sellEntry_low = ta.valuewhen(sellEntry,low,0)
buyEntry_index = ta.valuewhen(buyEntry,bar_index,0)
buyEntry_hi = ta.valuewhen(buyEntry,high,0)
buyEntry_lo = ta.valuewhen(buyEntry,low,0)


plotshape(buyEntry, color = color.green, location = location.belowbar, style = buyShapeOption, size = size.small)
plotshape(sellEntry, color = color.red, location = location.abovebar, style = sellShapeOption, size = size.small)
plot(emaInd, color=emaColor)


// Risk Management
entry_price_long = (buyEntry_hi + syminfo.mintick)
entry_price_short = (sellEntry_low - syminfo.mintick)
long_sl_price = (buyEntry_lo-syminfo.mintick)
short_sl_price = (sellEntry_hi + syminfo.mintick)
long_tp_price = ((entry_price_long - long_sl_price)*rr) + entry_price_long
short_tp_price = entry_price_short - ((short_sl_price - entry_price_short)*rr)


long_sl_ticks = (entry_price_long - long_sl_price) / syminfo.mintick
short_sl_ticks = (short_sl_price - entry_price_short) / syminfo.mintick


long_tp_ticks = (long_tp_price - entry_price_long) / syminfo.mintick
short_tp_ticks = (entry_price_short - short_tp_price) / syminfo.mintick


// Positions
if (buyEntry)
    strategy.entry("Long", strategy.long,stop = H + syminfo.mintick)
if strategy.position_size > 0
    strategy.exit("Long Ex","Long", loss = long_sl_ticks, profit = long_tp_ticks, comment_loss = "SL Long", comment_profit = "TP Long")


if (sellEntry)
    strategy.entry("Short", strategy.short,stop = L - syminfo.mintick)
if strategy.position_size < 0
    strategy.exit("Short Ex","Short",loss = short_sl_ticks, profit = short_tp_ticks, comment_loss = "SL Short", comment_profit = "TP Short")


// Cancel order if close beyond ema
if (C < emaInd)
    strategy.cancel("Long")


if (C > emaInd)
    strategy.cancel("Short")


// Go flat at close (for futures funded account)
if strategy.position_size > 0 and flatOpen
    strategy.close_all(comment = "EOD Flat")
if strategy.position_size < 0 and flatOpen
    strategy.close_all(comment = "EOD Flat")

//END