Estratégia de tendência de quebra de momentum após tendência melhorada
Visão geral
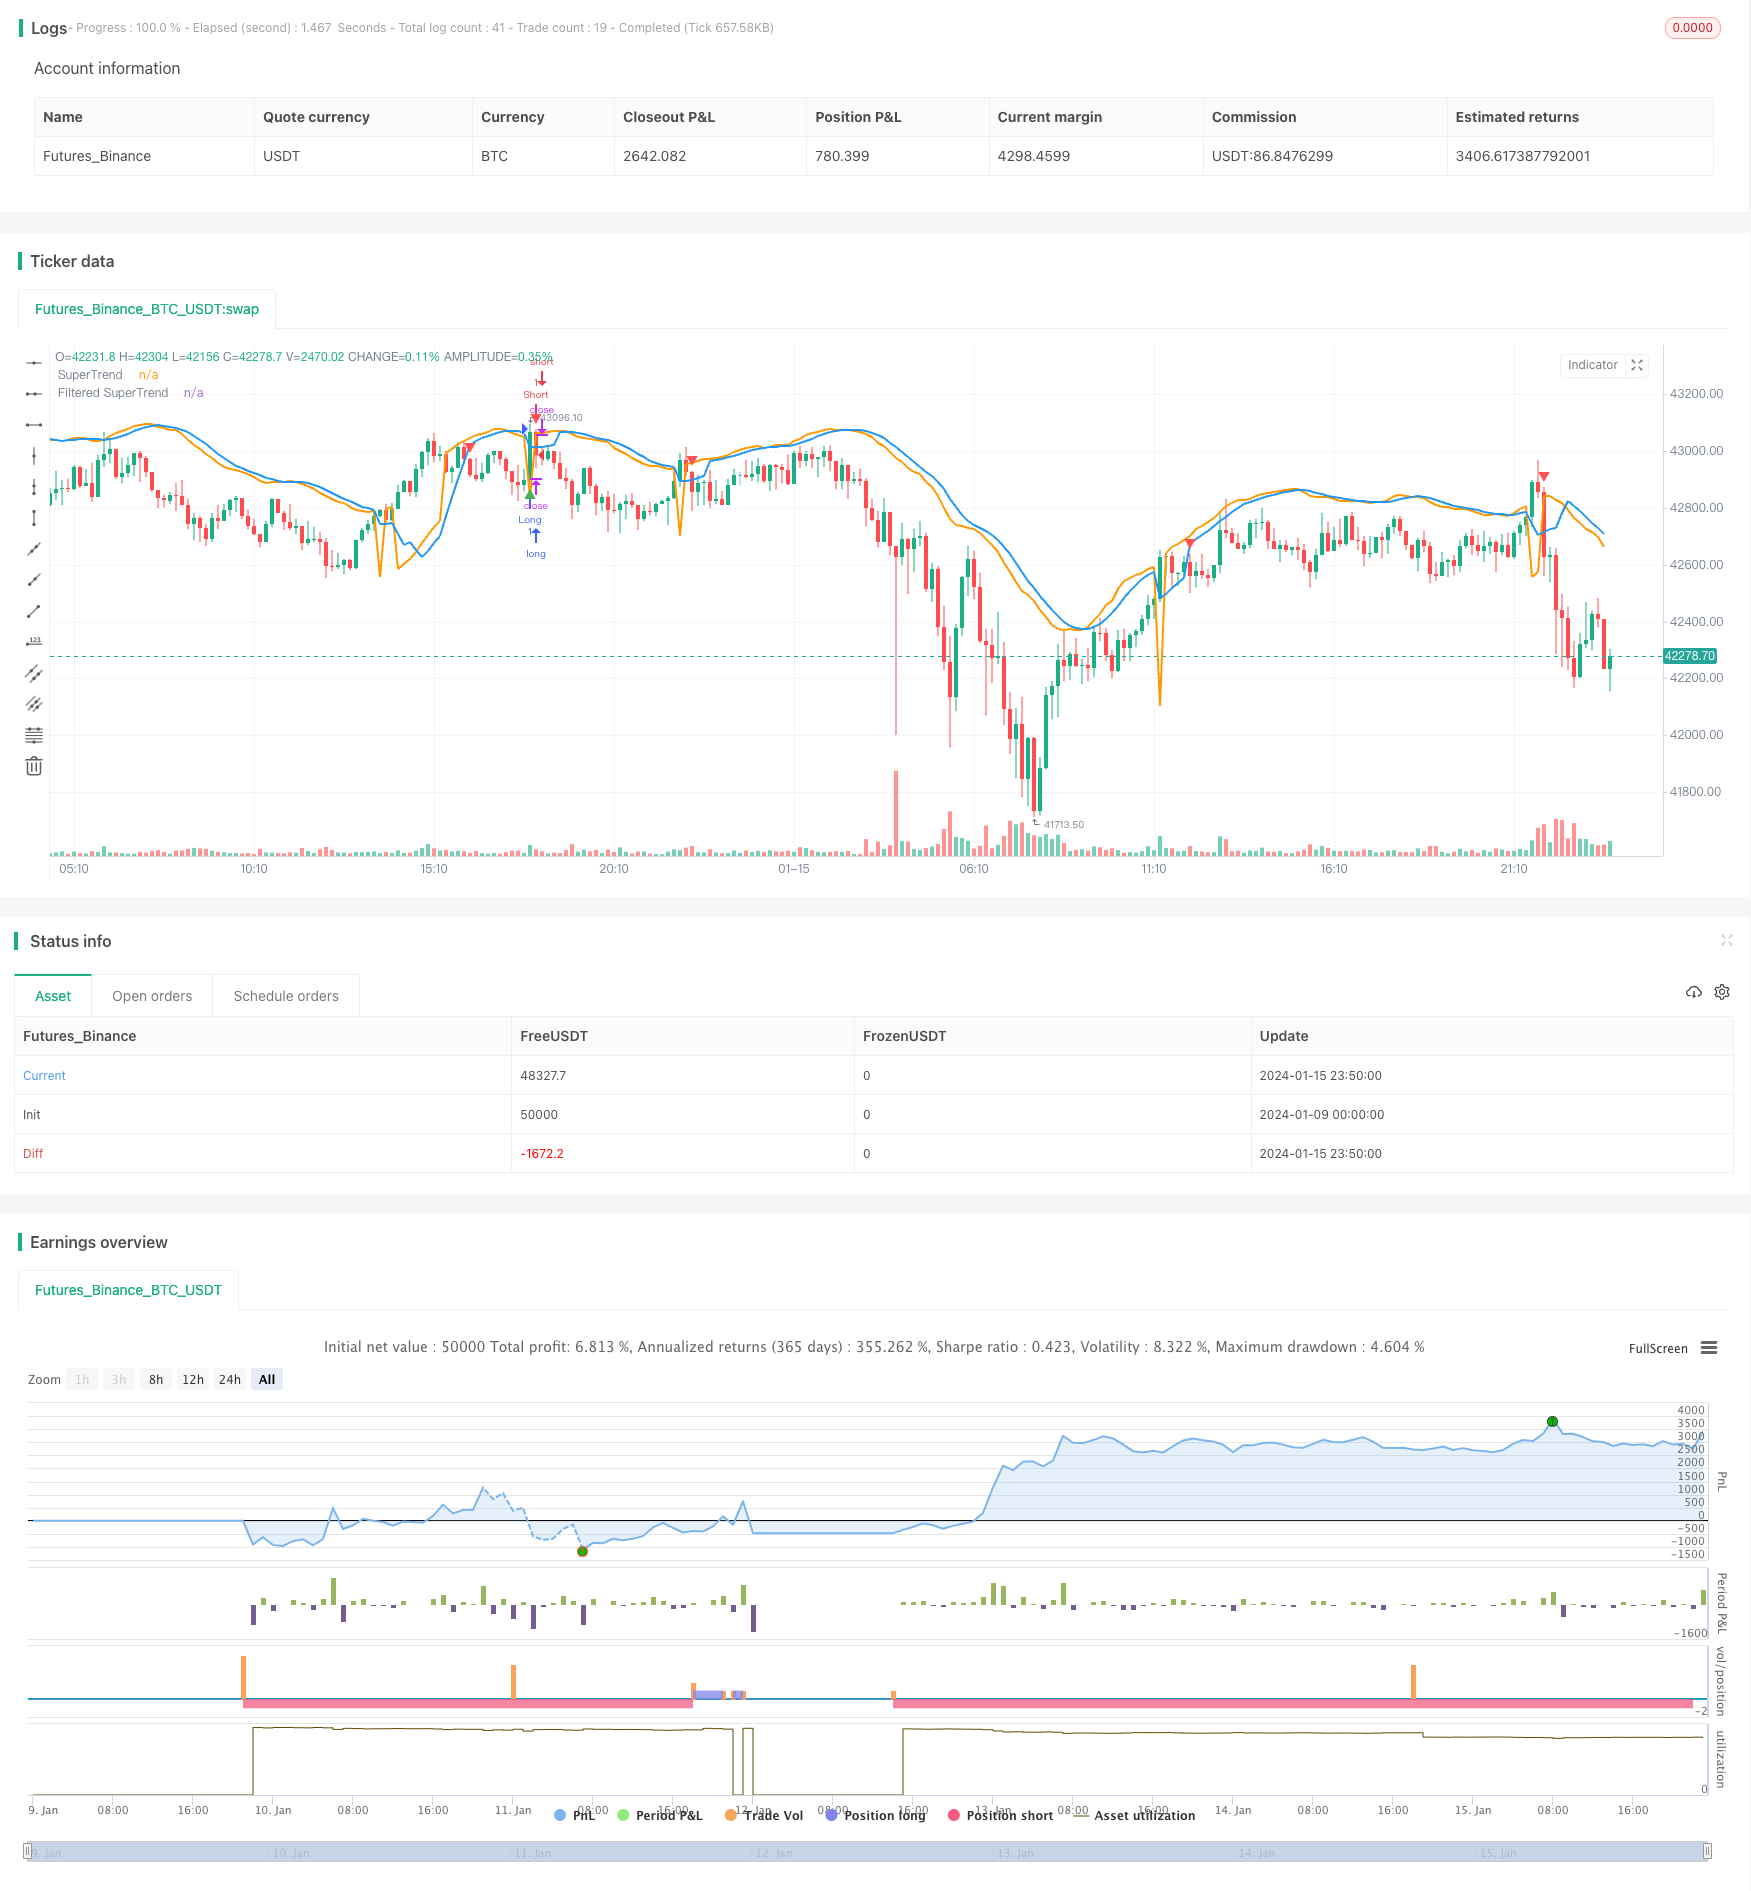
Este artigo analisa em detalhe uma estratégia de acompanhamento de tendências melhorada, combinada com o indicador SuperTrend e o filtro Stochastic RSI. A estratégia visa gerar sinais de compra e venda, considerando as tendências do mercado e reduzindo os falsos sinais. O RSI está destinado a evitar falsos sinais em casos de sobrecompra e sobrevenda.
Princípio da estratégia
Calculação da SuperTrend
Em primeiro lugar, calcule o real range of fluctuation (TR) e o real range of fluctuation (ATR). Em seguida, use o ATR para calcular a subida e a descida:
A trajectória ascendente = SMA (preço de fechamento, ATR) + ATR multiplicado por ATR Trilha inferior = SMA (preço de fechamento, ATR) - ATR multiplicado por ATR
Se o preço de fechamento for acima do descida, é uma tendência ascendente; se o preço de fechamento for abaixo do ascendente, é uma tendência descendente. Na tendência ascendente, o SuperTrend é descendo; na tendência descendente, o SuperTrend é ascendente.
Mecanismo de filtragem
A fim de reduzir os sinais falsos, a SuperTrend é usada como uma média móvel para obter uma SuperTrend filtrada.
Stochastic RSI
Calcule o valor do RSI e, em seguida, aplique o indicador estocástico para gerar o RSI estocástico. Ele reflete se o RSI está em uma área de sobrecompra ou sobrevenda.
Condições de entrada e saída
Condições de compra: Preço de fechamento em SuperTrend após a ruptura e em tendência ascendente, e Stochastic RSI < 80 Condições de venda: Preço de fechamento abaixo do SuperTrend após a ruptura e em uma tendência de queda, e Stochastic RSI > 20
Saída de compra: o preço de fechamento do supertrend após a ruptura e está em alta Saída e venda: Preços de fechamento em tendência de queda após a superação do SuperTrend
Vantagens estratégicas
Esta é uma estratégia de acompanhamento de tendências melhorada, que tem as seguintes vantagens em comparação com indicadores como as médias móveis simples:
- A SuperTrend tem uma forte capacidade de reconhecimento de tendências e de filtragem de falsos sinais.
- A aplicação de um mecanismo de filtragem reduz ainda mais os falsos sinais, tornando os sinais mais confiáveis.
- O RSI estocástico evita os falsos sinais gerados por um excesso de compra e venda, permitindo que a estratégia emita sinais perto de áreas de resistência de suporte importante.
- A estratégia considera simultaneamente a direção da tendência e a situação de overbought e oversold do Stochastic RSI, melhor equilibrando a relação entre o acompanhamento da tendência e a prevenção de falsos sinais.
- Os parâmetros da estratégia podem ser ajustados de forma flexível para diferentes cenários de mercado.
Riscos e otimização estratégica
Riscos possíveis
- No entanto, a maioria dos investidores não tem conhecimento de quaisquer outras opções disponíveis.
- O SuperTrend e o mecanismo de filtragem estão atrasados e podem ter perdido a última mudança de preço.
- A configuração incorreta dos parâmetros do RSI estocástico também pode afetar o desempenho da estratégia.
Gestão de Riscos
- Ajustar o stop loss apropriadamente, ou usar o stop loss de incumprimento
- Ajustar os parâmetros ATR ciclo, ciclo de filtragem para equilibrar o atraso.
- Testar e otimizar os parâmetros do RSI estocástico.
Direção de otimização
- Teste diferentes combinações de parâmetros para encontrar o melhor.
- Experimente diferentes mecanismos de filtragem, como a suavização do EMA.
- Aplicar algoritmos de aprendizagem de máquina para otimizar automaticamente os parâmetros.
- Em combinação com outros indicadores, a admissão complementar é baseada em:
Resumir
Esta estratégia integra os benefícios de dois indicadores, o SuperTrend e o Stochastic RSI, que são capazes de identificar tendências com eficiência e emitir sinais de negociação de alta qualidade. O mecanismo de filtragem também torna a estratégia mais robusta para o ruído do mercado. Esta estratégia pode obter melhores efeitos de estratégia por meio de otimização de parâmetros e pode ser considerada em combinação com outros indicadores ou modelos.
/*backtest
start: 2024-01-09 00:00:00
end: 2024-01-16 00:00:00
period: 10m
basePeriod: 1m
exchanges: [{"eid":"Futures_Binance","currency":"BTC_USDT"}]
*/

//@version=5
strategy("Improved SuperTrend Strategy with Stochastic RSI", shorttitle="IST+StochRSI", overlay=true)

// Input parameters
atr_length = input(14, title="ATR Length")
atr_multiplier = input(1.5, title="ATR Multiplier")
filter_length = input(5, title="Filter Length")
stoch_length = input(14, title="Stochastic RSI Length")
smooth_k = input(3, title="Stochastic RSI %K Smoothing")

// Calculate True Range (TR) and Average True Range (ATR)
tr = ta.rma(ta.tr, atr_length)
atr = ta.rma(tr, atr_length)

// Calculate SuperTrend
upper_band = ta.sma(close, atr_length) + atr_multiplier * atr
lower_band = ta.sma(close, atr_length) - atr_multiplier * atr

is_uptrend = close > lower_band
is_downtrend = close < upper_band

super_trend = is_uptrend ? lower_band : na
super_trend := is_downtrend ? upper_band : super_trend

// Filter for reducing false signals
filtered_super_trend = ta.sma(super_trend, filter_length)

// Calculate Stochastic RSI
rsi_value = ta.rsi(close, stoch_length)
stoch_rsi = ta.sma(ta.stoch(rsi_value, rsi_value, rsi_value, stoch_length), smooth_k)

// Entry conditions
long_condition = ta.crossover(close, filtered_super_trend) and is_uptrend and stoch_rsi < 80
short_condition = ta.crossunder(close, filtered_super_trend) and is_downtrend and stoch_rsi > 20

// Exit conditions
exit_long_condition = ta.crossunder(close, filtered_super_trend) and is_uptrend
exit_short_condition = ta.crossover(close, filtered_super_trend) and is_downtrend

// Plot SuperTrend and filtered SuperTrend
plot(super_trend, color=color.orange, title="SuperTrend", linewidth=2)
plot(filtered_super_trend, color=color.blue, title="Filtered SuperTrend", linewidth=2)

// Plot Buy and Sell signals
plotshape(series=long_condition, title="Buy Signal", color=color.green, style=shape.triangleup, location=location.belowbar)
plotshape(series=short_condition, title="Sell Signal", color=color.red, style=shape.triangledown, location=location.abovebar)

// Output signals to the console for analysis
plotchar(long_condition, "Long Signal", "▲", location.belowbar, color=color.green, size=size.small)
plotchar(short_condition, "Short Signal", "▼", location.abovebar, color=color.red, size=size.small)

// Strategy entry and exit
strategy.entry("Long", strategy.long, when=long_condition)
strategy.entry("Short", strategy.short, when=short_condition)
strategy.close("Long", when=exit_long_condition)
strategy.close("Short", when=exit_short_condition)